

The setup
You use one fixed historical day, so every number below matches what you see: Brent crude, Monday 13 Jul 2026. That day Brent’s 30D ATM implied vol jumped by 19.9 vol points. Every page you open for a past date uses only data up to that date.1. Open the Radar on 13 Jul 2026
Open Radar and set Date to 13 Jul 2026 (or open/radar?d=2026-07-13). Leave Market on All markets.
You should see:
- a Historical snapshot banner: every number on the page uses data up to 13 Jul 2026 only. Go to the latest takes you back to today.
- the date strip, with 13 Jul showing 6 notable and 13 watch discoveries.
- the Market snapshot. Three of its lines involve Brent: its 25Δ risk reversal at +18.5 pts (96th percentile of five years), its 25Δ butterfly at +2.8 pts (95th) and its 30D–180D vol term spread at +19.9 pts (94th).
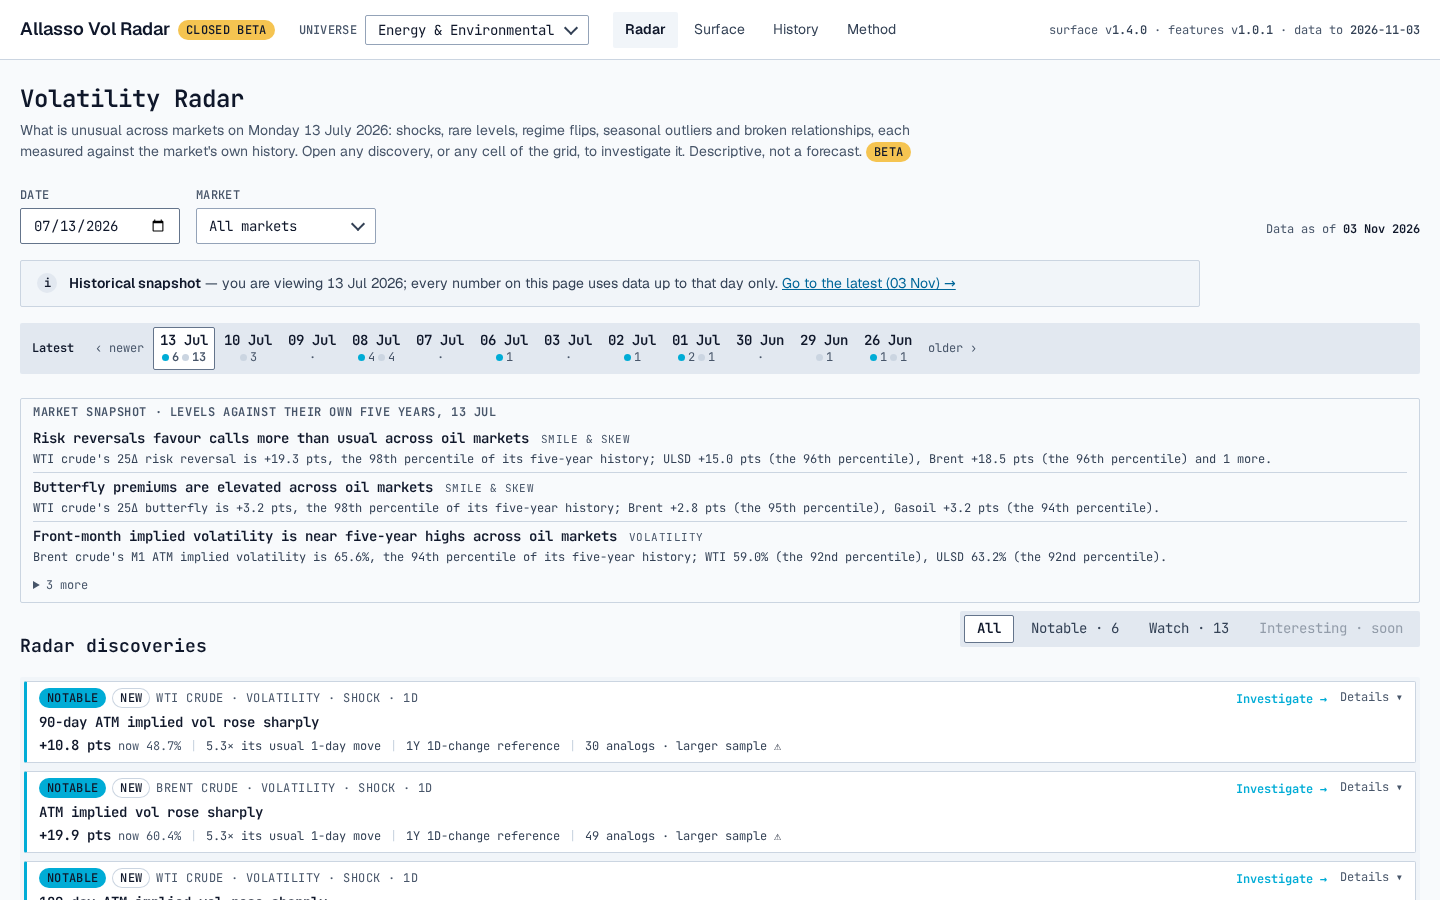
The Radar on 13 Jul 2026, with the historical snapshot banner and the first discoveries.
2. Find the discovery
Under Radar discoveries, click Notable · 6 to show the notable discoveries only. Find this card:NOTABLE · NEW · Brent crude · Volatility · Shock · 1D ATM implied vol rose sharply · +19.9 pts, now 60.4% · 5.3× its usual 1-day move · 49 analogs · larger sample ⚠Open Details to read how it was measured. The reference is Brent’s 30D constant-maturity ATM vol, against its 1-day changes over the trailing year (252 sessions, the day excluded). The ⚠ is a data-quality note: IV interpolated between listed expiries; day passed the checks with a warning. Why it matters: a 1-day shock is notable at 3.5× its usual daily change. At 5.3×, this one is well past that threshold. Brent’s vol term structure (30D − 180D) also has a notable shock that day: up 13.8 pts to +19.9 pts.
3. Investigate the move
Click Investigate → on the card. The investigation page has four sections.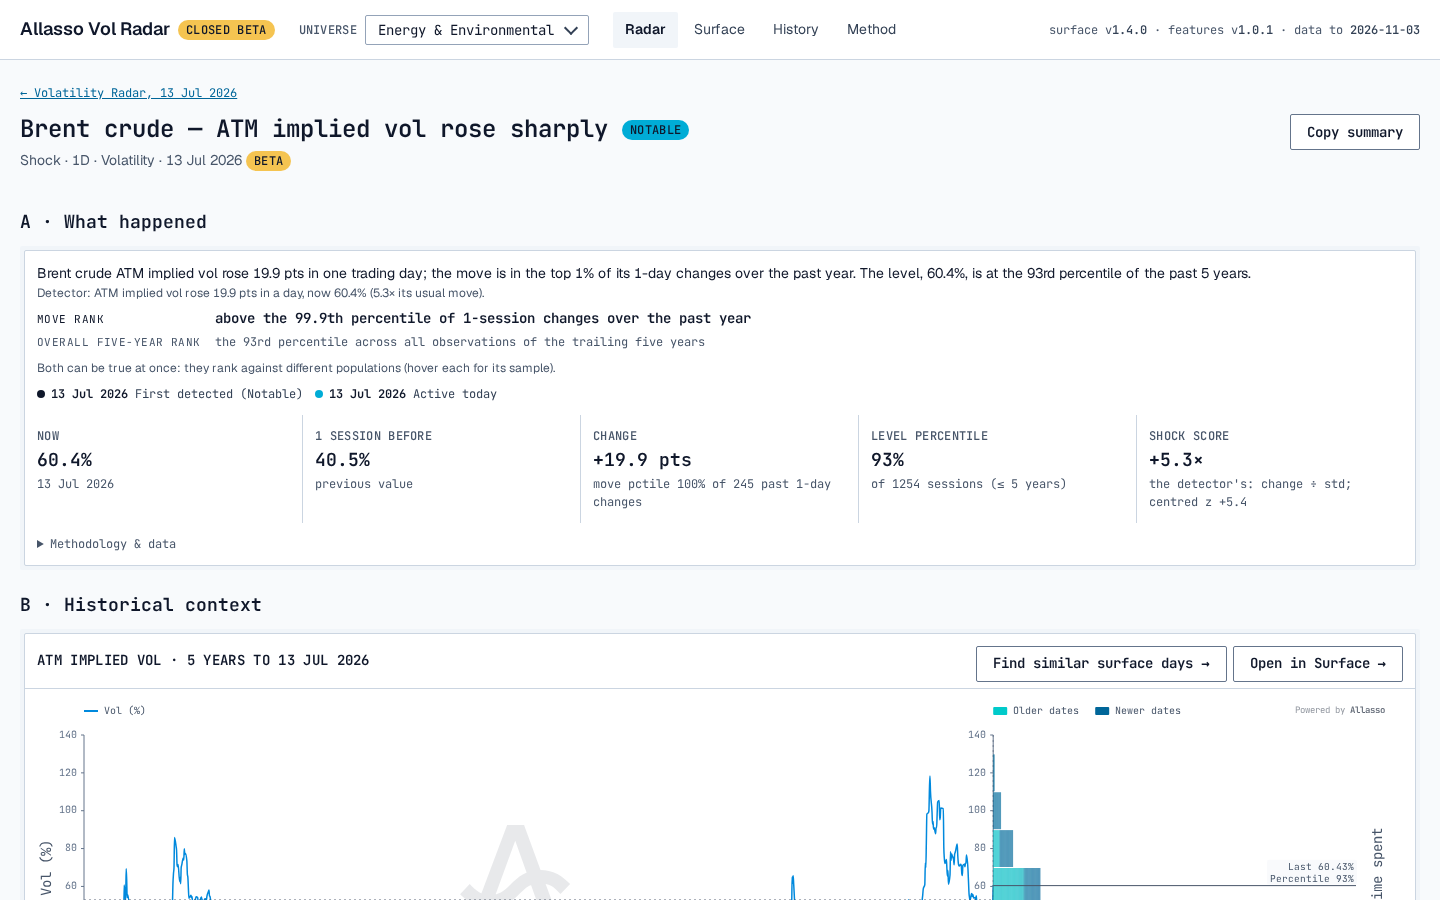
The investigation page: section A, What happened.
The range is wide. In the ATM implied vol tab, twenty sessions later the changes run from −41.0 to +66.7 pts.
The card in step 2 said 49 analogs, while section C counts 51. The two summaries use slightly different samples.
D · Explore structures. This lists the structure families that express a view on ATM vol: straddle, strangle
and calendar. The All structures after earlier moves like this table then enters every structure after the 20
most recent earlier signals, on the front listed expiry, held 20 sessions, with placeholder costs, on model prices.
The short ATM straddle carries suggested: short: unhedged, it made a median +2.5% of the futures price, profitable
in 75% of trades, with a worst trade of −14.6%. Delta-hedged, its median was −0.1%. Click any median to see the trade
on the day and the P&L of each earlier trade by sessions held.
4. Compare with similar past surfaces
In section B, click Find similar surface days →, or open History with Brent crude and 13 Jul 2026 (/analogs?m=BRENT&d=2026-07-13). Keep Match on set to shape + recent move.
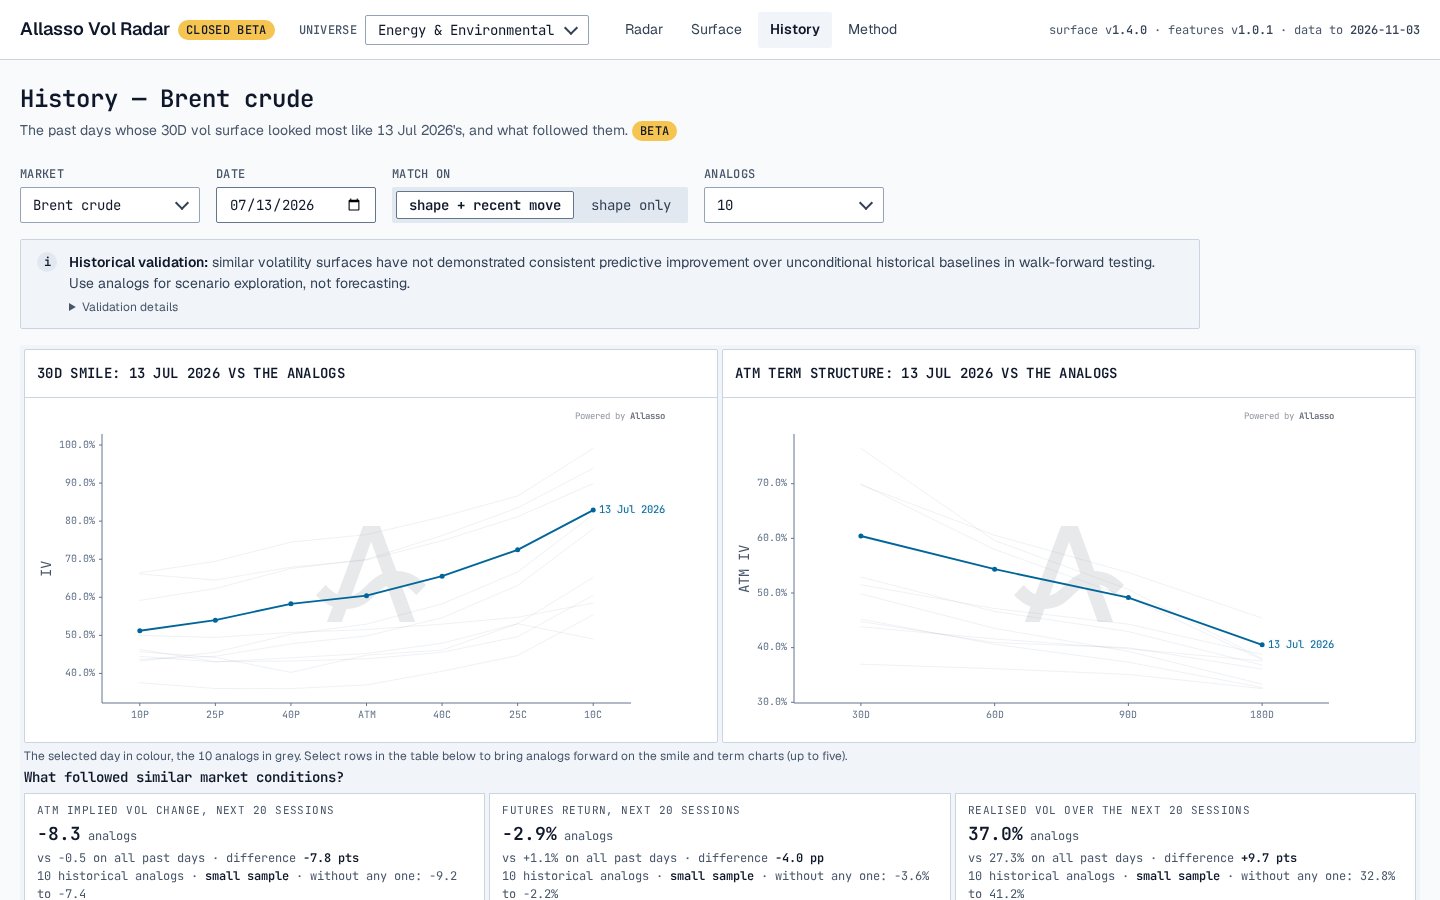
History for Brent crude on 13 Jul 2026: the validation note, the outcome cards and the closest days.
Historical validation: similar volatility surfaces have not demonstrated consistent predictive improvement over
unconditional historical baselines in walk-forward testing. Use analogs for scenario exploration, not forecasting.
Ten is a small sample, and each card says so. Without any one shows how far the median moves when a single analog
is left out (−9.2 to −7.4 pts for ATM vol).
5. Test your own scenario
Back on the investigation, click Test My Scenario → in the header of section D. It opens Test My Scenario for Brent crude on 13 Jul 2026, with this signal’s earlier cases as the history. Section A shows the day’s market: the front future at 83.3 USD, 30D ATM IV 60.4%, the 25-delta risk reversal +18.5 pts and the 30D − 180D term spread +19.9 pts. Enter a view that vol will come down: ATM IV change −10 vol pts, no futures move, no skew change, Holding period 20 trading days, defined-risk structures only. Click Calculate scenario P&L.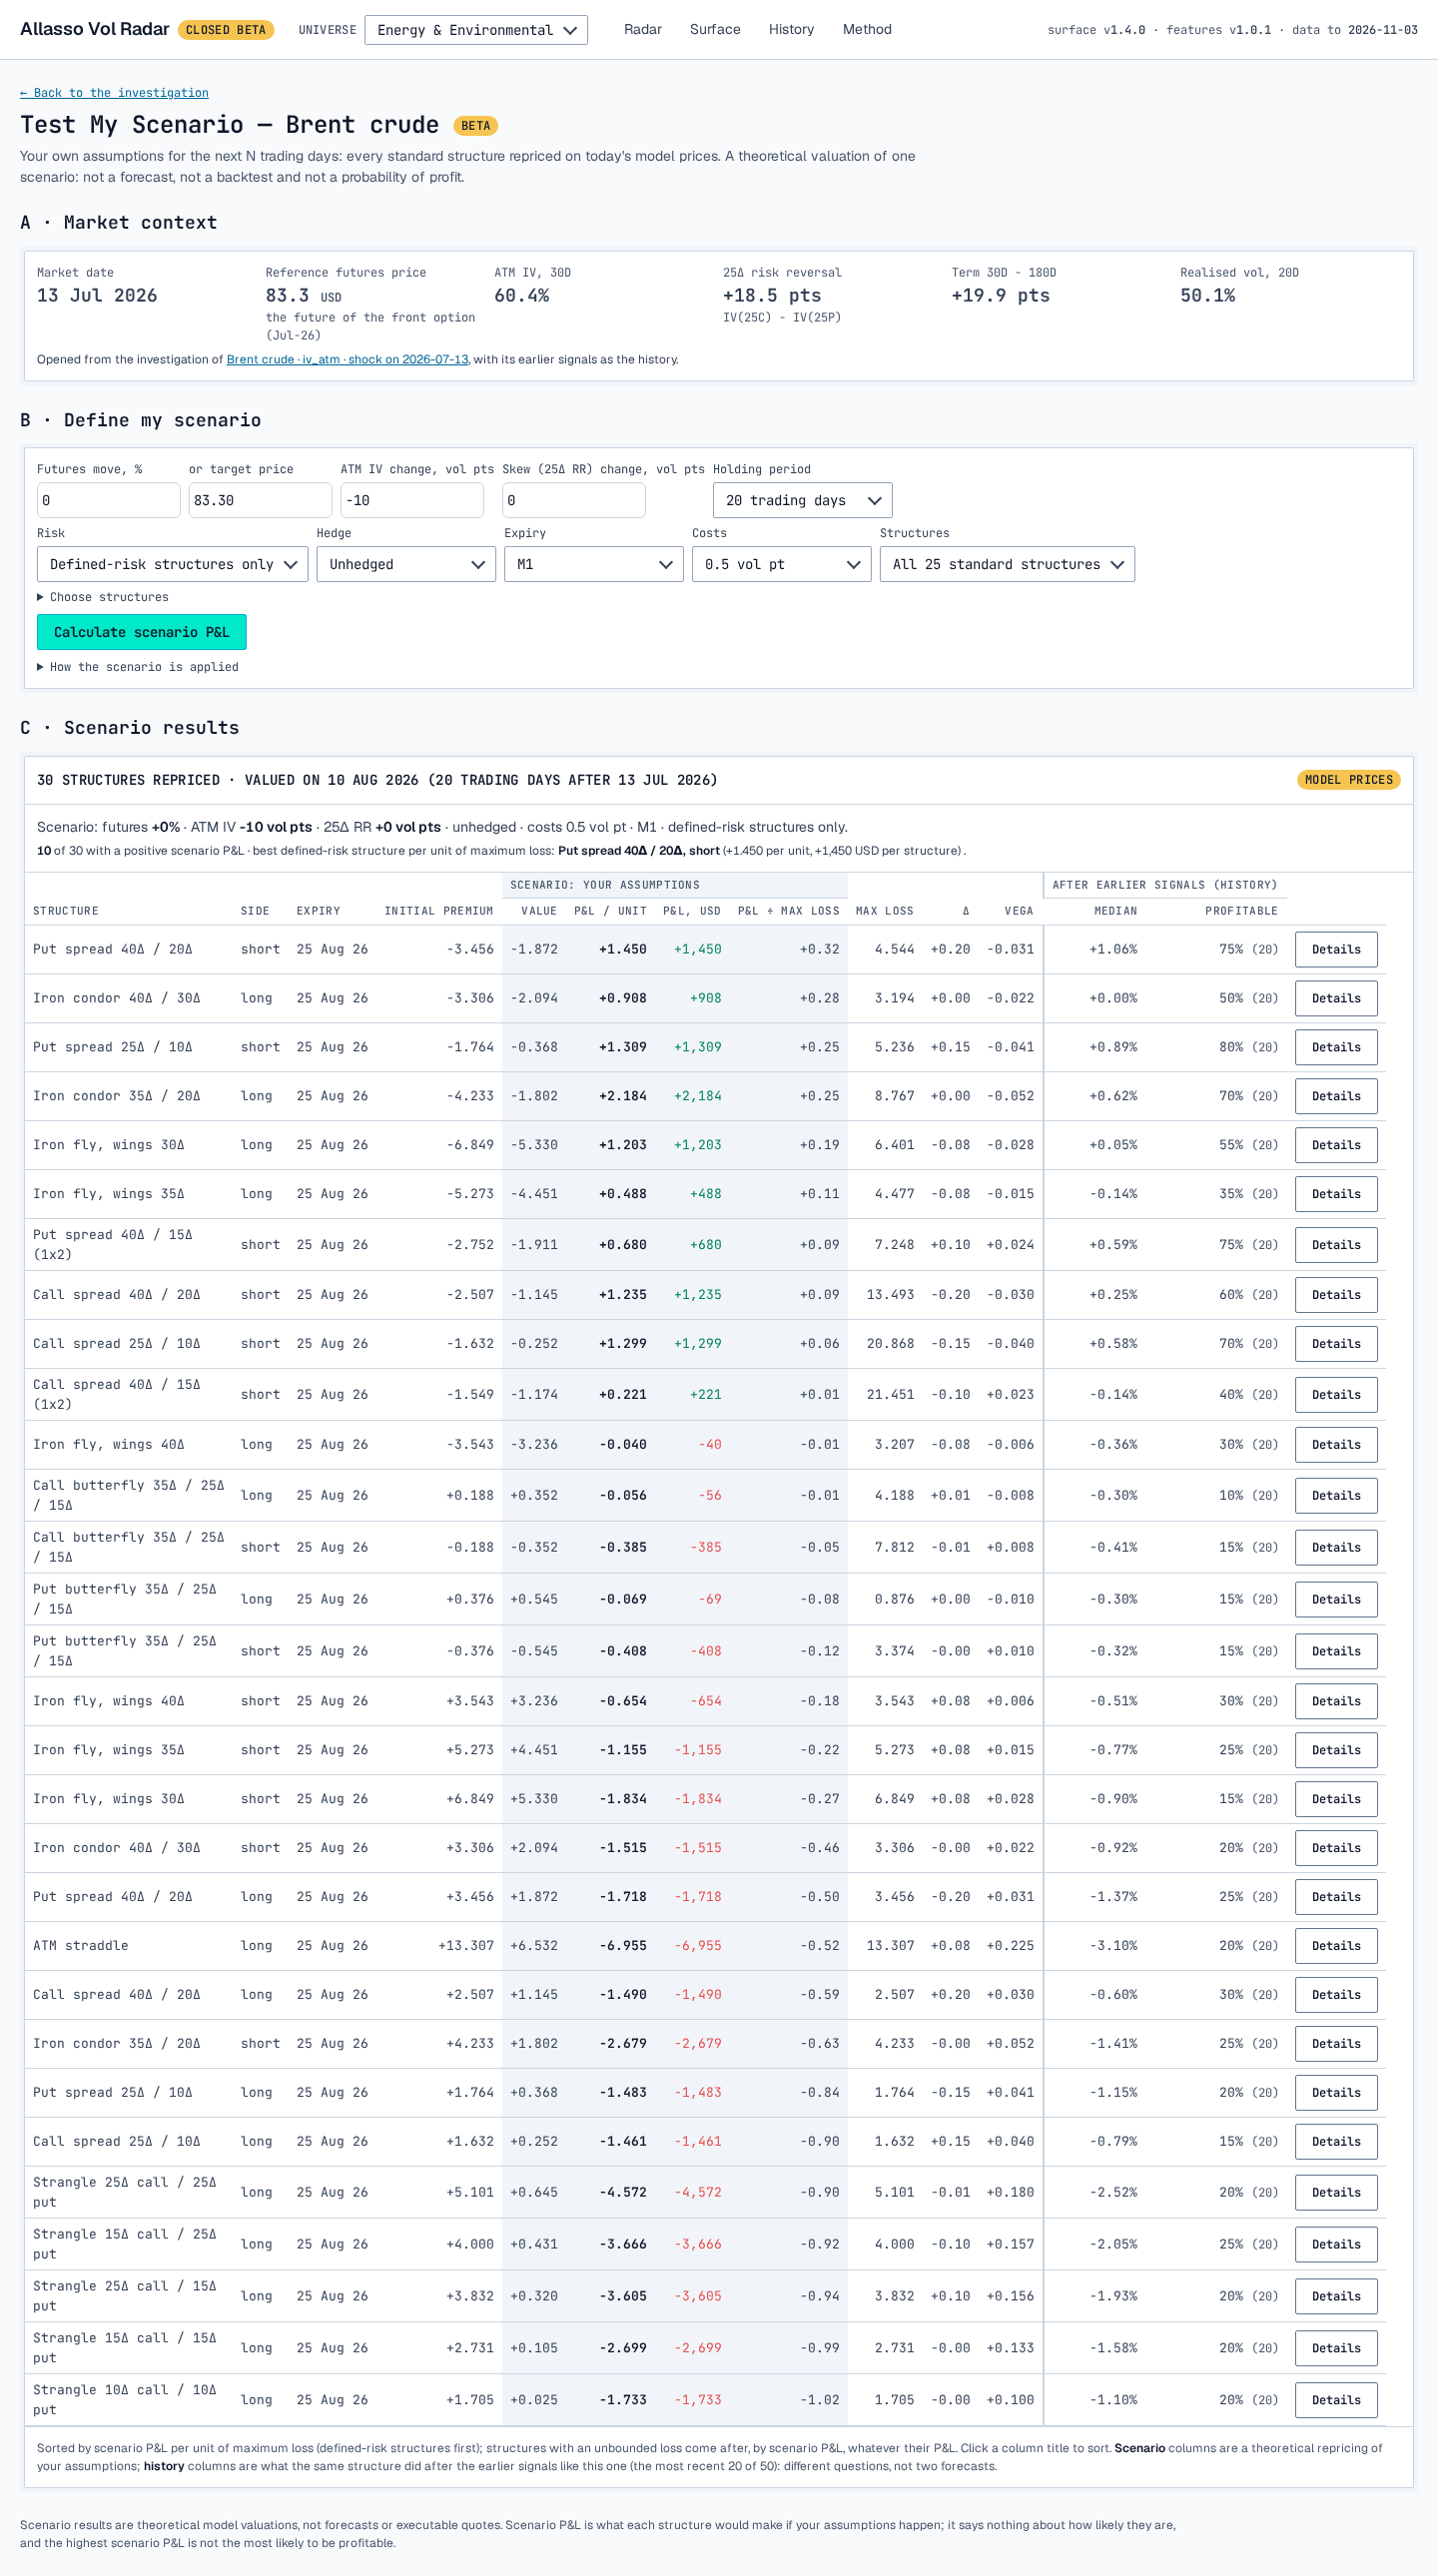
Test My Scenario for Brent crude on 13 Jul 2026: ATM IV −10 vol pts over 20 trading days.
The history columns beside them show what the same structures did after the earlier signals like this one, for
comparison: the short 40Δ / 20Δ put spread made a median +1.06% of the futures price, profitable in 75% of 20 trades.
That is a different question from the scenario. Click Details on a row for its exact legs, prices and Greeks now
and in the scenario.
What you found
On 13 Jul 2026, Brent’s 30D ATM vol rose 19.9 pts in a day to 60.4%. It was the largest 1-day change of the past year, with the level at the 93rd percentile of five years. Skew and the vol term structure were also near their five-year highs. In the past, ATM vol was lower 20 sessions after similar shocks in about two cases out of three. Over the 10 most similar surfaces it fell further than on an average day. Both samples are small, outcomes vary widely, and similar surfaces have shown no forecasting skill. Test My Scenario then showed how each structure would do if vol fell by 10 points over 20 trading days, and what each one risks. Whether that view is right is your call.Next steps
- Investigate a move: every section of the investigation page in detail.
- History: similar past surfaces and Test My Scenario.
- Radar: daily discoveries: severity tiers, filters and the market grid.
- Surface report: open the Brent surface for 13 Jul 2026.
- How ML Data and Vol Radar compute implied volatility.