

When to use it
- A surface looks unusual and you want to know when it last looked like this, and what followed.
- You came from an investigation and want context beyond earlier signals of the same kind.
- You want to see how option structures did after similar days, then test your own scenario.
How similar days are found
1
Reduce each day's surface to a few numbers
On the 30D surface (90D for EUA carbon, whose 30D history is thin before 2025): the level (log of ATM vol), the
term (30D ATM − 180D ATM), the skew (25-delta risk reversal) and the curvature (25-delta butterfly).
With shape + recent move, two more: the 5-day change of ATM vol and the 5-day futures return, so “high and
rising” is not matched with “high and falling”.
2
Put them on one scale
Each number is divided by how much it usually varies in that market: its median absolute deviation over the
market’s history up to the chosen day only.
3
Measure the distance
A weighted distance over the scaled differences. Weights: level, term and skew 1, curvature 0.75, the 5-day vol
change 0.75, the 5-day futures return 0.5.
4
Pick the closest days, with rules
Only days whose 20-session outcome was already known on the chosen day; at most one per 20 trading days, so one
episode cannot fill the list. History needs about three years of data before the first query and at least 100
eligible days.
Settings
Reading the page
Smile and ATM term structure. The chosen day in colour, the similar days in grey. Select rows in the table below to bring up to five of them forward. What followed similar market conditions? Three cards: the median ATM vol change, futures return and realised vol over the next 20 sessions, after the similar days and over all past days, with the difference. without any one shows how far the median moves when a single similar day is left out. Fewer than 20 cases read small sample. The closest days. Each similar day with its surface numbers, its Similarity rank (the share of eligible days that were further away: “top 0.1%”), and its outcomes. Similarity breakdown shows how much each number adds to the distance. Outcome by outcome. One tab per outcome: 30-day ATM vol, futures return and realised vol. Each has a table after 1, 5, 10 and 20 sessions (median, mean, 25th–75th, share higher, min · max, evidence) and the path of the similar days from 20 sessions before to 60 after, with the chosen day up to the day. A similar day counts at a horizon only if that many sessions had passed by the chosen day. These are the same tables as on the investigation page, with the similar days as the cases. All outcomes. The similar days against all past days, including a straddle and a delta-hedged straddle held 20 days. Explore structures after the similar days. Every structure in Vol Radar’s set entered on each similar day and held as chosen, priced on model prices: the same panel as section D of the investigation page, with every similar day as a case. Test My Scenario → opens Test My Scenario for the market and day.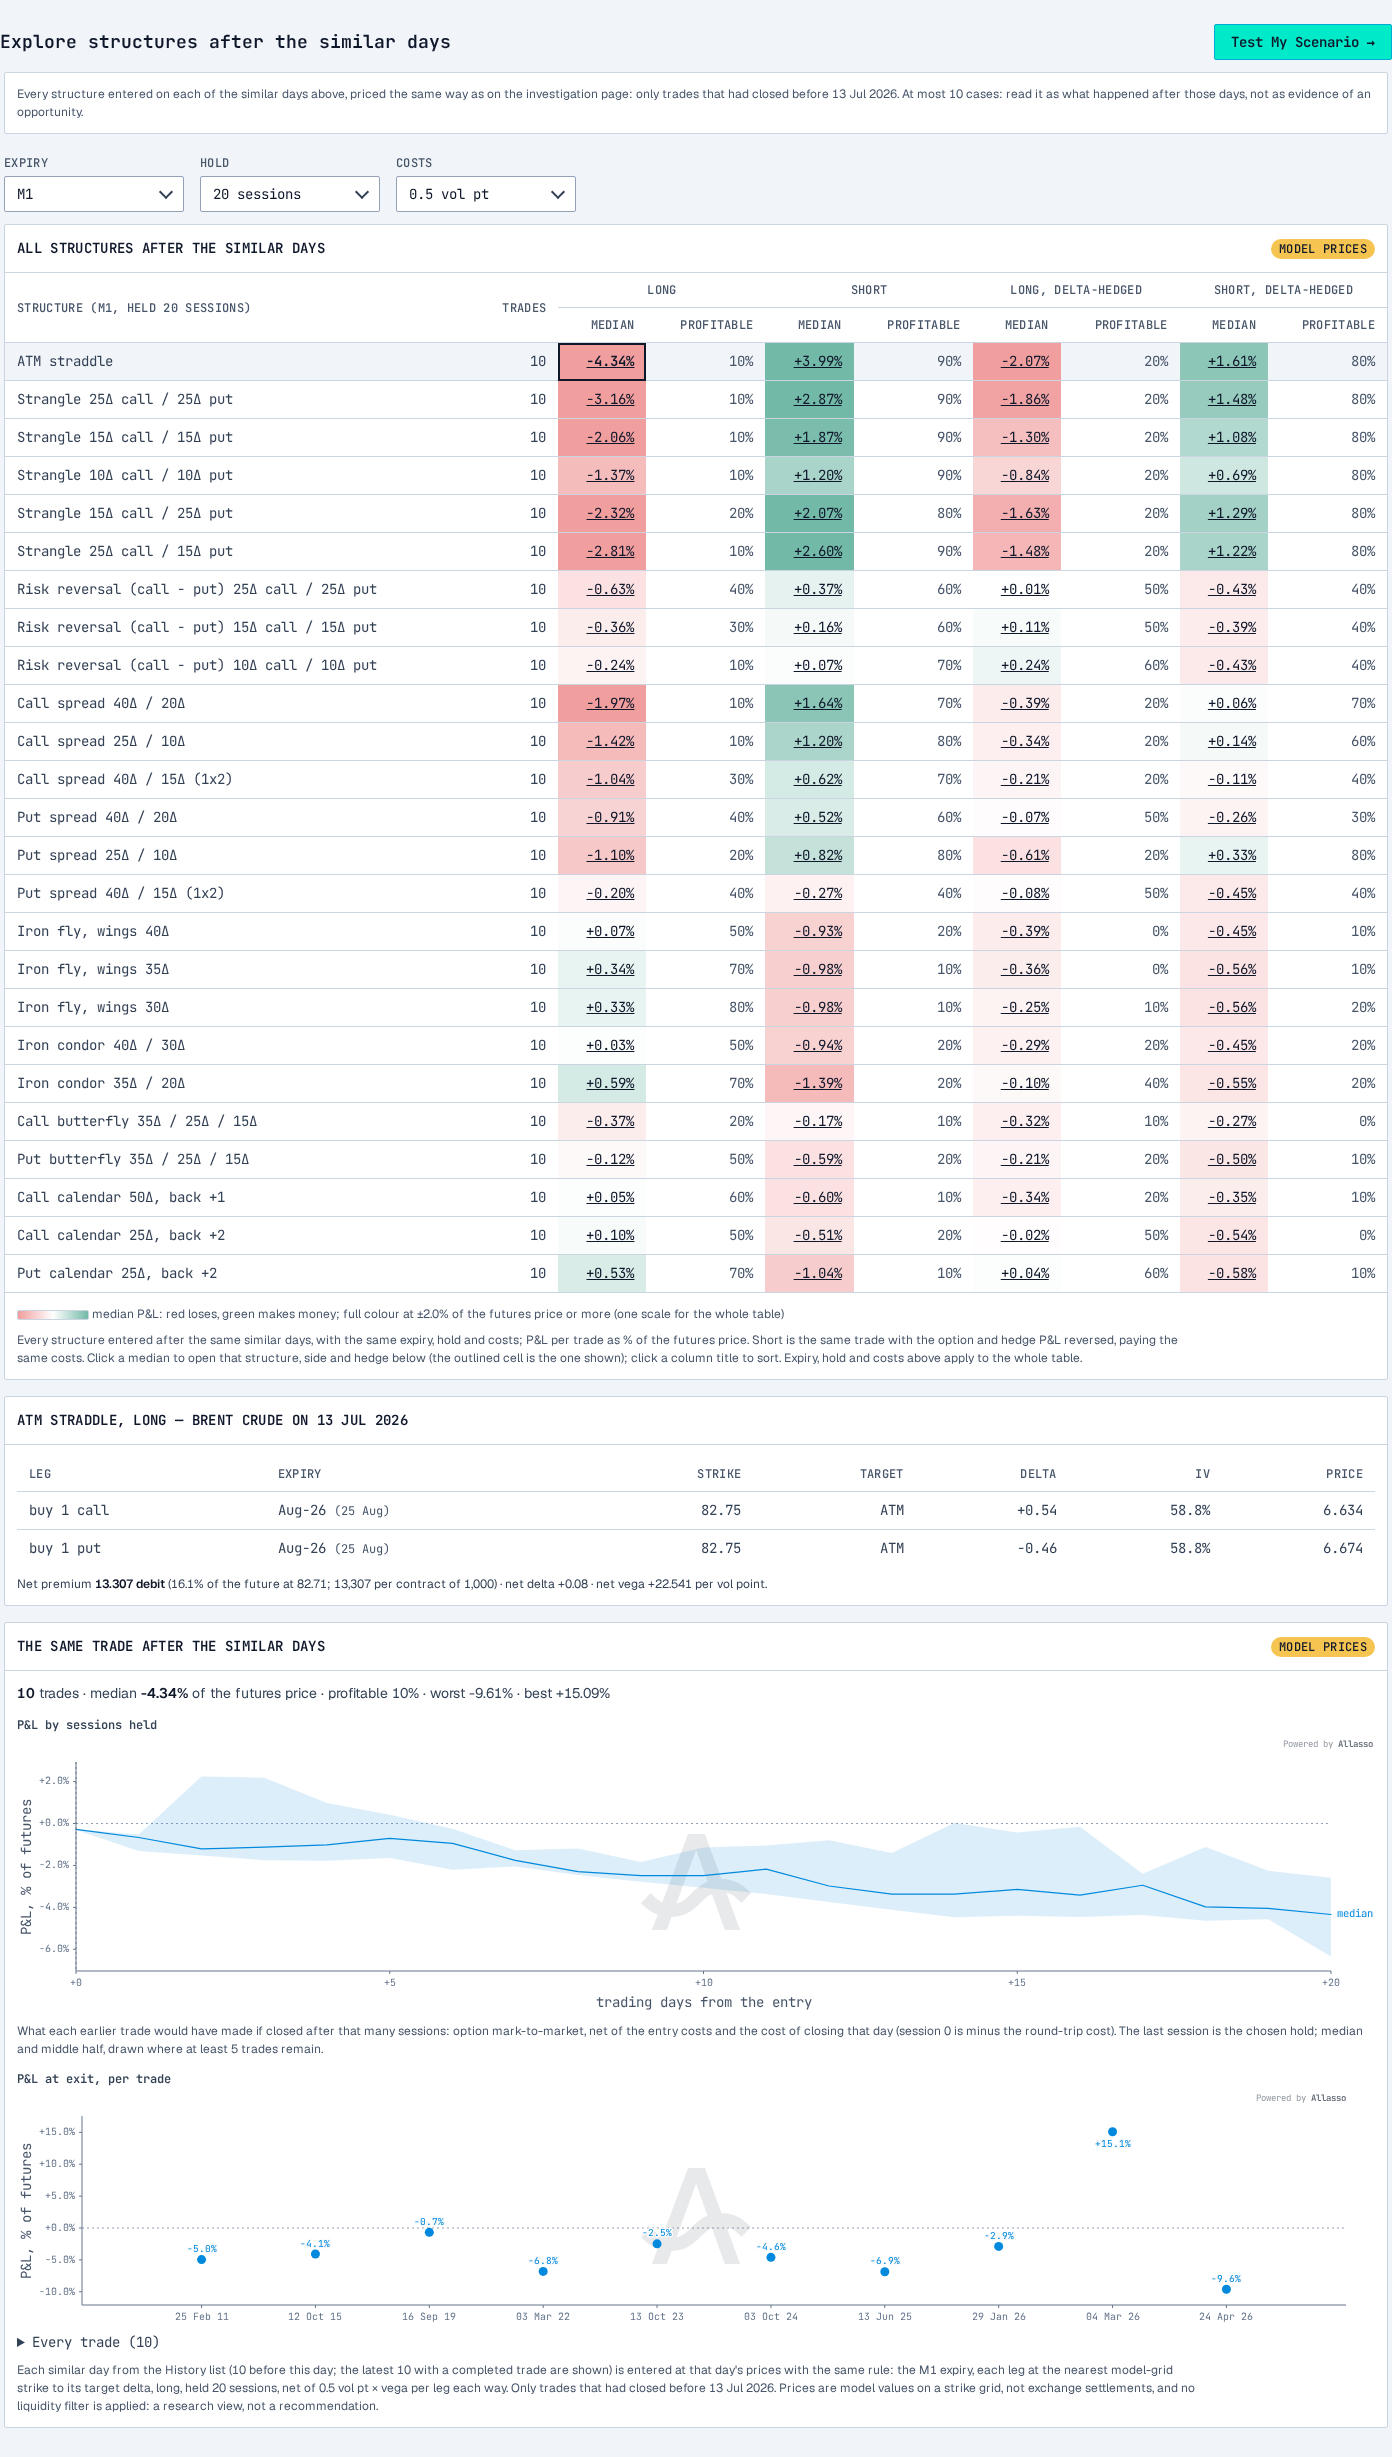
Brent crude, 13 Jul 2026: the structures after the 10 similar days, with Test My Scenario in the header.
Example
Brent crude, 13 Jul 2026 (/analogs?m=BRENT&d=2026-07-13): 10 closest days from 4,785 candidates; the closest is 3 Mar
2022. Over the next 20 sessions the similar days saw a median ATM vol change of −8.3 vol pts, against −0.5 on all past
days, and a futures return of −2.9% against +1.1%. Both are a small sample.
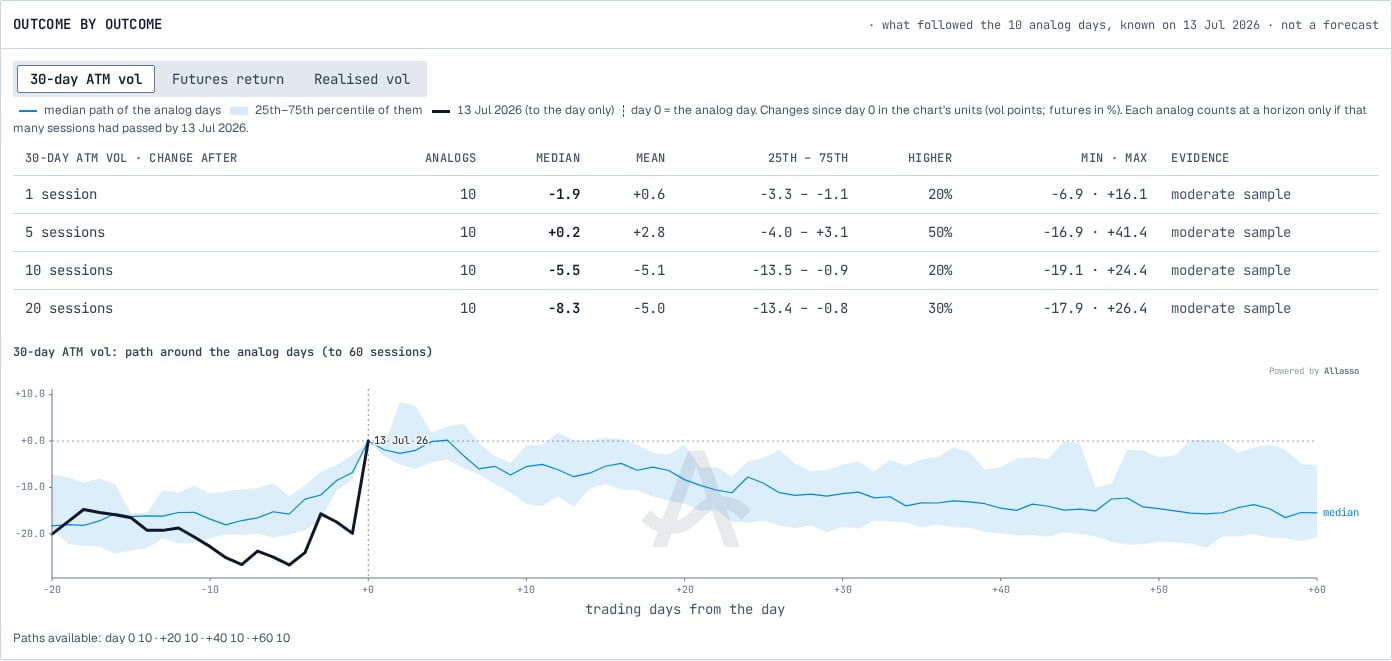
The Outcome by outcome card for the same day.
Limitations
- Similar surfaces showed no forecasting skill against all past days in walk-forward testing. Use History for scenario exploration, not to predict.
- Ten similar days are very few. Leave-one-out ranges show how fragile a median is.
- Regime changes (2020 oil, 2022 gas) dominate the errors. Structure results use model prices and placeholder costs.