

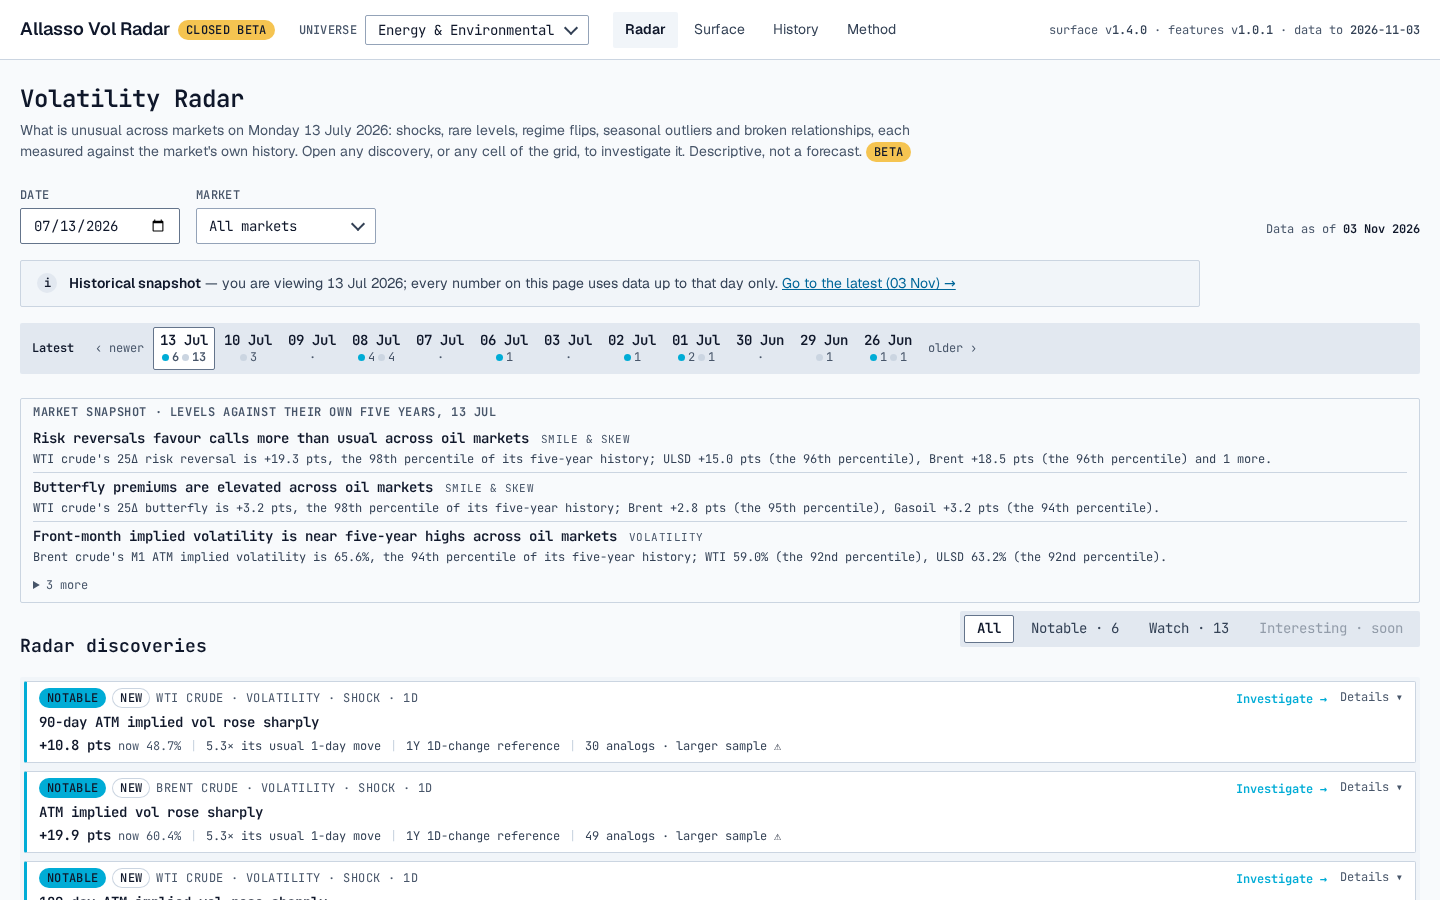
The Radar for 13 Jul 2026: the menu, the Universe dropdown, the date strip and the day's discoveries.
What you can do
The menu has four areas. Vol Radar opens on Radar.Radar
See what is unusual across markets on a day: shocks, rare levels, regime flips, seasonal outliers and broken
relationships. Open any discovery to investigate it.
Surface
Read one market’s implied vol at seven forward deltas by listed contract, rank or period, against an earlier date
or its own history.
History
Find the past days whose surface shape was closest to a chosen day’s, see what followed them and how option
structures did after them.
Method
How the Surface, Radar and History pages are built.
Test My Scenario
Not in the menu: open it from an investigation or from History. Enter your own futures move, vol change, skew change
and holding period, and compare every standard option structure repriced under it.
The Universe dropdown
The Universe dropdown in the header filters every market list in the app. Your access includes one universe, Energy & Environmental, with all the markets below. Vol Radar remembers your choice between visits.Access
Vol Radar is in closed beta. Open it from allasso.app and log in with your Allasso account; the header shows closed beta. The same data is available as JSON through the Vol Radar API.Data and coverage
Every market in the beta has options analytics. The Radar also watches the 60-day return correlation of five market
pairs: Brent crude–WTI crude, Brent crude–ICE gasoil, ICE gasoil–NY Harbor ULSD, TTF gas–EUA carbon and TTF gas–Henry
Hub gas.
Timing. Vol Radar is a daily product. Every number comes from the exchanges’ daily settlement prices. The data is
refreshed each business morning with the previous session’s settlements. The header shows the last date loaded
(“data to …”). Futures and option volume and open interest are the previous session’s figures, published the next
morning.
Get started
1
Open Vol Radar
Log in at allasso.app/vol-radar. It opens on the Radar page for the
latest day.
2
Read the day's discoveries
Use the All, Notable and Watch filters. Click Investigate → on a discovery to open its
investigation. See Radar: daily discoveries and
Investigate a move.
3
Look at the surface
Open Surface to see the full smile and term structure of a market and how each point compares with its
history. See Surface report.
4
Follow the tutorial
Tutorial: from a Radar alert to a trade idea takes one real day
through Radar, the investigation, History and Test My Scenario.