

When to use it
- You want the whole surface on one screen, with what moved since last week or last month.
- You want to know if a part of the curve or the smile is high or low against its own history.
- You trade periods (quarters, seasons, half-years, years) and want their vol as an option strip.
Before you start
The page covers the markets with options analytics. The Columns choices depend on the market:Steps
1
Pick the market and day
Choose Market and Date. If the date has no data, the page shows the nearest earlier day and says
“No data on … — showing …”.
2
Choose the columns
Under Columns, pick Contracts, Relative (M1…) or a period type. Show sets how many columns you see.
3
Set the comparison
Pick a Compare with preset, or type a day in or a date. Then choose Show in cells: IV change,
Percentile or Z-score.
4
Click a cell
The smile panel, the Vol Context panel and the cell history open below the grid for that column and delta.
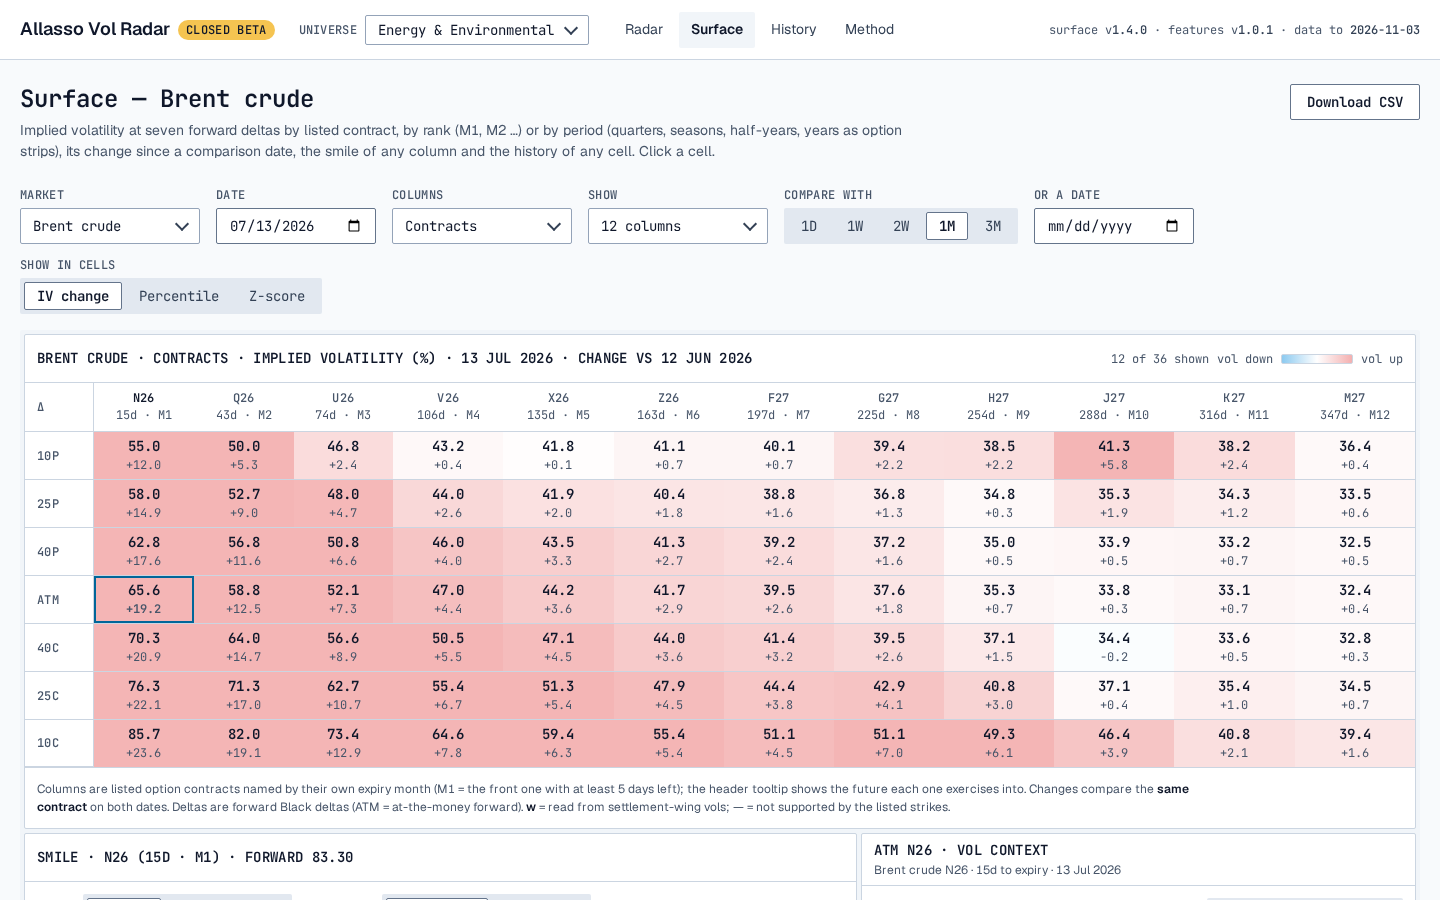
Brent crude, 13 Jul 2026: contracts view, change against 12 Jun 2026
Settings
Some deployments offer only 6M, 1Y and 3Y in Historical window.
Reading the result
Columns
- Contracts. One column per listed option, named by the option’s own expiry month. The header shows days to expiry and the rank; its tooltip names the future the option exercises into. Changes compare the same contract on both dates.
- Relative (M1…). M1 is the front listed option with at least 5 days left, M2 the next, and so on. Changes compare the same rank, so after an expiry M1 is a different contract.
- Quarters, Seasons, Half-years, Years. Each column is an option strip: one option per member month at a common strike. The header shows days to the first expiry and how many months are in the strip (“3/3 mo”). A period drops once its first month is within 5 days of expiry. Changes compare the same named period.
Cells
The large number is implied vol in percent. The small number depends on Show in cells:- IV change: today minus the comparison date, in vol points. Blue is vol down, red is vol up.
- Percentile: the share of days in the window with lower vol in the same column rank (M1, M2 …, or the n-th period); ties count half. 50% is the median day.
- Z-score: (today − average) ÷ standard deviation over the same days.
- w: read from settlement-wing vols, beyond the fitted smile.
- *: incomplete strip, where a member month is not listed yet or not priced. The same mark appears in the column header.
Smile panel
The panel title gives the column, days to expiry and its forward. Its table lists, per delta, the Strike (the Strip strike for a period), IV %, IV change since the comparison date and the OTM premium (for a period, OTM premium, sum). The premium is a model price on the fitted smile, not a listed settlement. The panel also compares the smile with its history:- Smile: Absolute, or Relative to ATM (each smile minus its own ATM vol, so you compare shape alone).
- Reference: Rolling rank (whichever contract held this rank each day) or Similar DTE (every contract within ± 5, 10 or 20 days to expiry of today’s; default ± 10).
- Rows for the median, percentile and robust z = (now − median) ÷ (1.4826 × median absolute deviation), plus History coverage. A ⚠ on coverage means the gaps fall mostly on high-vol days, so that delta’s history is biased low.
Cell history and Vol Context
The History chart shows the selected cell’s implied vol through the window, with its forward on a hidden scale. For contracts and ranks it follows the rolling rank, and the note says how many times the column rolled. For periods, History follows lets you switch between the named period through its own life (complete strips only) and rank n. The right-hand panel shows how long vol spent at each level, older to newer. The Vol Context panel gives Last IV, Average, Percentile and Z-score against the reference population, the recent changes with their move percentile, and smile relative-value figures.Download CSV
Download CSV exports every column of the current view, not just the ones shown. Each row is one cell: date, market, view, column, rank, delta, the contract detail, IV, change, percentile, z-score, days of history, strike, premium and status. Vols and changes are decimals (0.55 = 55%).Example
Open/report?m=BRENT&d=2026-07-13. With Contracts and 1M, the front contract N26 (15 days, M1) shows ATM
65.6% and +19.2 points since 12 Jun 2026. Its forward is 83.30. Click the cell: the smile table gives the 25C strike as
93.57 at 76.3% vol. With the default Rolling rank reference over 1Y, the comparison uses 257 smiles from 13
contracts. Vol Context shows Last IV 65.6%, Average 46.5%, Percentile 78%.
The Radar flags this day at 60.4% ATM: that is the 30D constant-maturity point, interpolated between N26 and Q26, not
the M1 contract.
Limitations
- Points beyond every listed strike stay empty; nothing is extrapolated.
- Percentile and z-score need at least 20 days of history in the window.
- In Relative view, a change across an expiry compares two different contracts.
- A preset comparison is empty when there is no data close enough to that many trading days back.
- Incomplete strips (*) have no percentile or z-score; the named-period history uses complete strips only.
- EUA carbon offers only Contracts and Relative columns; seasons exist only for TTF gas and Henry Hub gas.