

When to use it
- A discovery on the Radar caught your eye and you want its size, rarity and history.
- A level sits at the edge of its five-year range and you want to know what followed earlier visits there.
- You want to see how option structures did after earlier moves like this one.
Before you start
Open a move page from the Radar: click a discovery card, Investigate →, a row of the ongoing-signals panel, or any grid cell. A grid cell can open the page in one of three ways:- With a signal that day: all four sections.
- Level band, an outlined cell with no signal whose level is in the top or bottom 10% of its five years: section C compares it with earlier entries into the same band, marked level band · not Radar signals.
- No signal: sections A, B and D only. The title reads “no Radar signal on” the day.
Steps
1
Check the size and rarity (A)
Read the sentence at the top, the ranks and the five stat cards. Open Methodology & data for the reference
and the quality flags.
2
Place it in five years (B)
Look at the level chart, the distribution table and the earlier Radar signals on this metric. Find similar
surface days → and Open in Surface → sit in this section’s header.
3
See what followed earlier moves (C)
Read the summary table, then switch between the outcome tabs for each outcome’s table and paths chart.
4
Explore structures (D)
Compare every structure after earlier moves like this, then open one for its trade on the day and its trades
after those moves. Test My Scenario → reprices them all under your own assumptions.
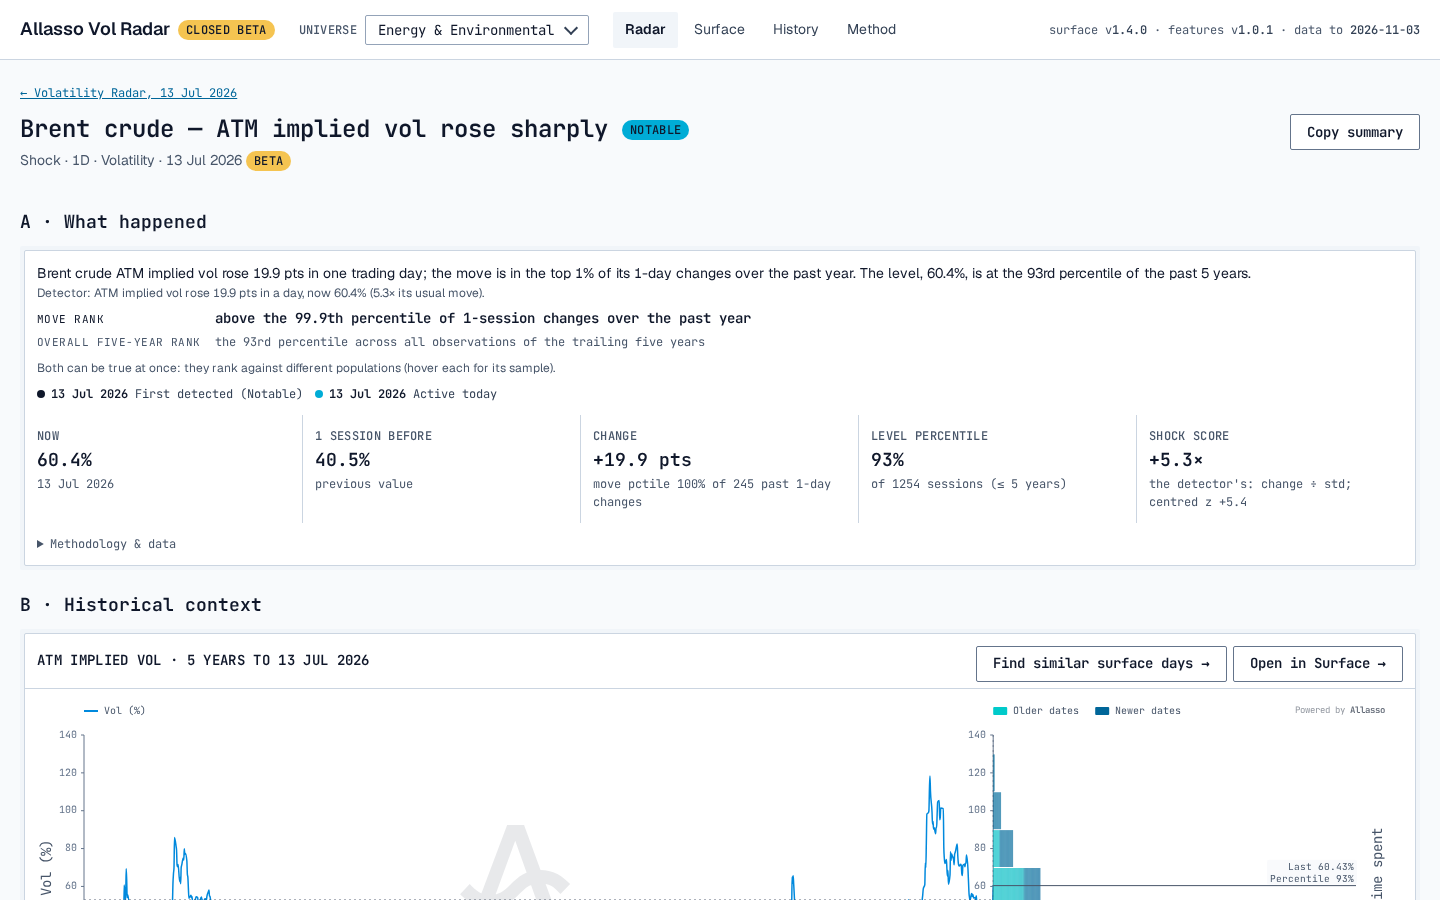
Brent crude, ATM implied vol shock on 13 Jul 2026: the header and section A.
Settings
Copy summary copies a plain-text summary of the signal: headline, date, tier and type, the detector’s sentence,
how rare it is, the historical context, data-quality flags and the method. It appears only when the day has a signal.
Reading the result
A · What happened
- The sentence: the change and where it ranks among the past year’s changes of that length, then the level’s percentile over the past five years. Below it is the detector’s own sentence.
- Ranks: the detector’s rank first (Move rank for shocks and activity, Detector rank for extremes and correlations, Seasonal rank for seasonal signals), then the Overall five-year rank of the level. They rank against different populations, so both can be true. Hover each for its sample.
- Lifecycle: First detected, Escalated, Reopened, Resolved, then Still active or Active today, from events up to the day only.
- Stat cards: Now, the value N sessions before, Change (with its percentile among past changes), Level percentile (of up to 1,260 sessions), and Shock score (change ÷ standard deviation of past changes, with the centred z that also subtracts their mean).
B · Historical context
- Five-year chart: the metric over the five years to the day. It stops at the day (dashed line). The right panel shows how long the metric spent at each level. Dashed levels mark the five-year median and 10th / 90th percentiles. For a seasonal signal, the same month of earlier years is highlighted, and a Seasonal vs overall distribution chart compares the two populations.
- 5-year distribution: the 5th, 10th, 25th, 50th, 75th, 90th and 95th percentiles, and Now.
- Earlier Radar signals on this metric: up to 12 earlier signals, newest first. Each opens its own move page.
- Find similar surface days → opens History for the market and day (option markets). Open in Surface → opens the Surface report at the matching point, for vol metrics.
C · Historical analogs and outcomes
The card title reads “What followed N earlier … signals”, naming the signal type, or “What followed N earlier entries into the top (bottom) 10%” for a level band. The cases follow strict point-in-time rules:- Same kind: same market, metric, bucket, signal type, horizon and direction, strictly before the day, on a day that passed the quality checks. For a level band: earlier days the level entered the same 10% tail of its trailing five years after at least 20 sessions outside it.
- Spacing: at most one case per 20 trading days. Within a run of overlapping signals, only the first counts.
- Outcome already known: for each horizon, a case counts only if its outcome day is before the investigated day.
- Comparable magnitude only, with at least 10 events, repeats the medians for events whose score is within ⅔–1½× this one’s (shown when 5 or more match).
- The N events, one by one lists each case with its Score (σ) (or its Percentile for a level band) and how much the signal’s own metric changed from that case’s day to 1, 5, 10 and 20 sessions later.
- With fewer than 5 events, an Insufficient evidence note says no summary should be read into them.
D · Explore structures
D first lists the structure families that express a view on the metric, for example Straddle · Strangle · Calendar for ATM implied vol. It is a research starting point, not a recommendation. Test My Scenario → in the section header opens Test My Scenario for this market and day, with this signal’s earlier cases as its history columns (signals only, not level bands). All structures after earlier moves like this prices every structure in Vol Radar’s set after the same earlier moves, with the same Expiry, Hold and Costs. Each row is one structure. For each of long, short, long, delta-hedged and short, delta-hedged it shows the median P&L per trade, as % of the futures price, and the share of trades that were profitable.- Colour: red medians lose, green make money. Full colour is reached at one scale for the whole table, shown under it.
- suggested: long / short: the side the Radar lists first for this kind of move. A fixed rule of thumb, not fitted to the results. Check its column.
- Model prices: the trades use model prices on a strike grid, not exchange settlements, with no liquidity filter.
- Click a median to open that structure, side and hedge below. Click a column title to sort.
- The trade on the day: its legs, net premium, net delta and net vega, or “Not available on this day”.
- The same trade after earlier moves like this: trades, median, share profitable, worst and best.
- P&L by sessions held: what each earlier trade would have made if closed after that many sessions, net of the entry costs and the cost of closing that day. Session 0 is minus the round-trip cost. The median and middle half are drawn where at least 5 trades remain.
- P&L at exit, per trade: one dot per earlier trade, and Every trade lists them.
Example
Brent crude, ATM implied vol shock, 13 Jul 2026:/radar/move?d=2026-07-13&market=BRENT&metric=iv_atm&kind=shock&bucket=30D&horizon=1&direction=1
- A: “Brent crude ATM implied vol rose 19.9 pts in one trading day; the move is in the top 1% of its 1-day changes over the past year. The level, 60.4%, is at the 93rd percentile of the past 5 years.” Shock score +5.3×, centred z +5.4.
- C: 51 earlier signals, all a larger sample. After 20 sessions, ATM implied vol had a median change of −2.8 vol pts (37% rose), the futures return +1.0% (55% rose) and 20-day realised vol +1.3 vol pts (59% rose). The paths chart uses 50 of them, those with 60 sessions observed by the day.
- D: at the defaults (M1, 20 sessions, 0.5 vol pt), the short ATM straddle carries suggested: short. After 20 earlier moves it made a median +2.5% of the futures price, profitable in 75% of trades, worst −14.6%. Delta-hedged, the same short straddle’s median was −0.1%.
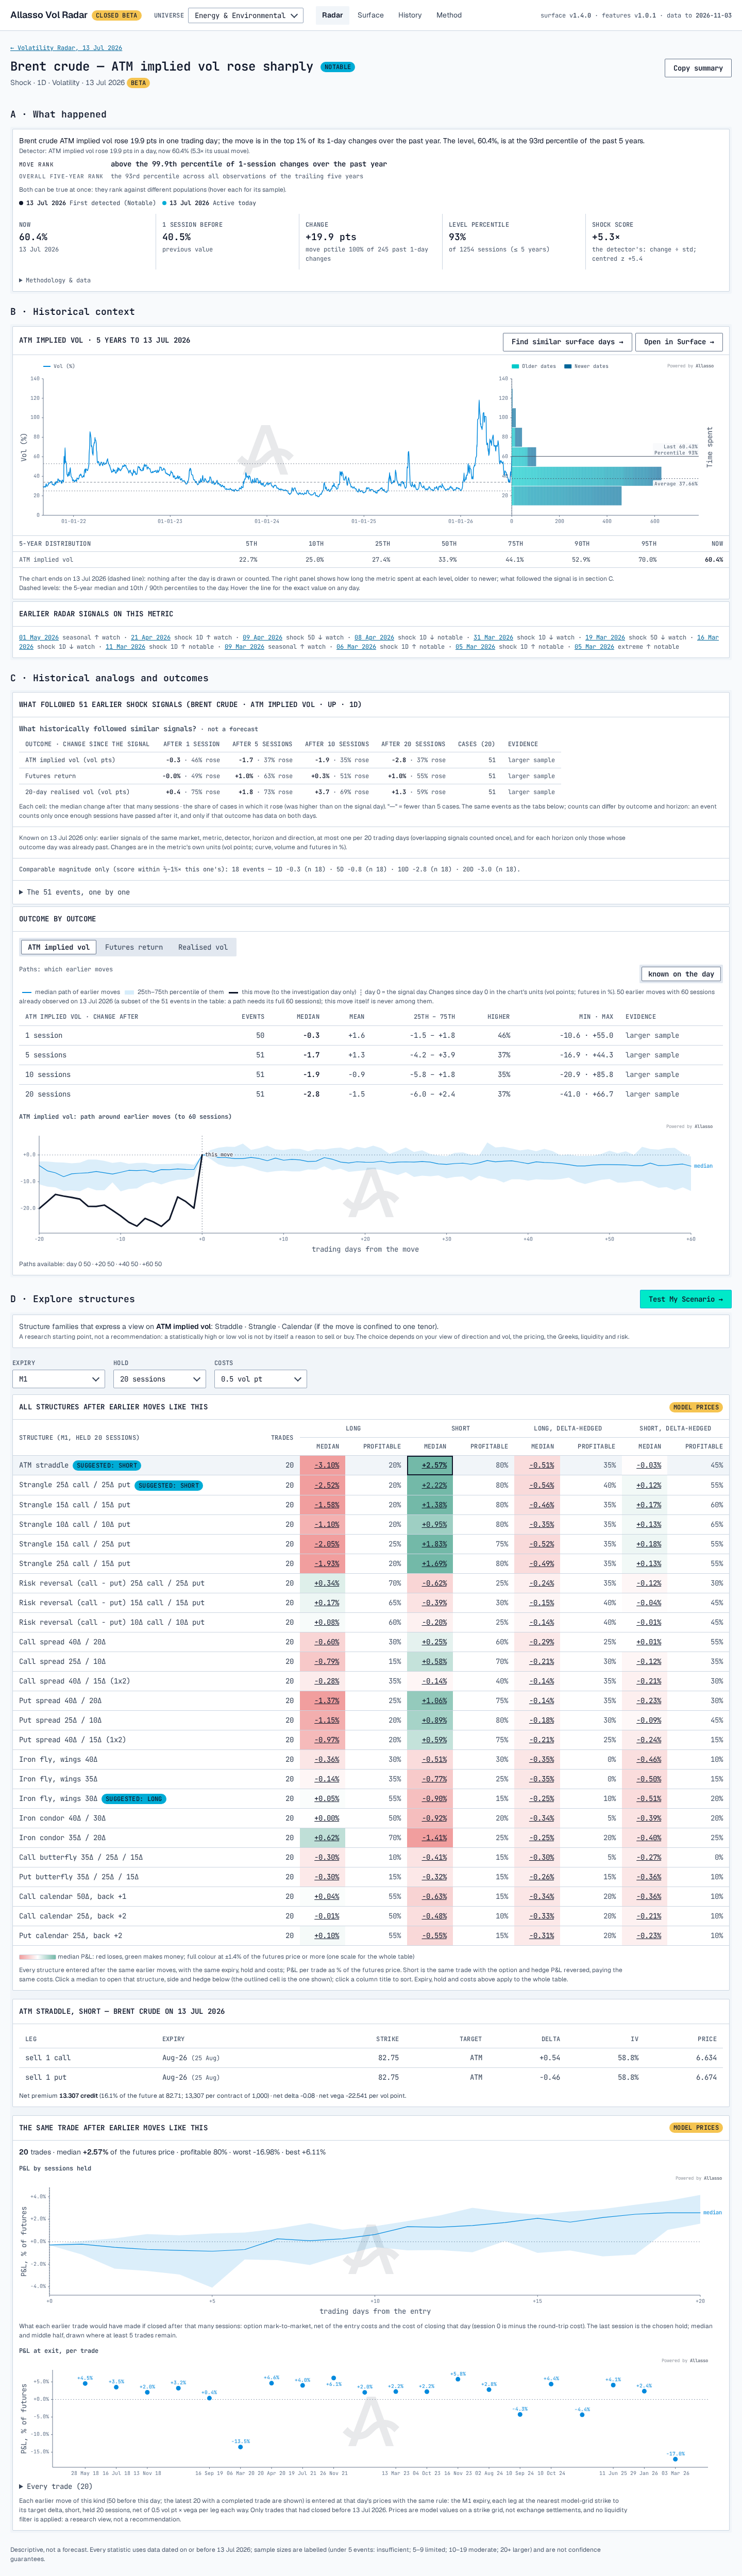
The whole page for the same move: sections A to D, with the outcome tabs and the all-structures table.
Limitations
- Descriptive, not a forecast. Sample sizes are labelled (under 5 events insufficient, 5–9 limited, 10–19 moderate, 20+ larger) and are not confidence guarantees.
- Structures use model prices on a strike grid, not exchange settlements, and no liquidity filter. Costs are placeholders: a fixed vol-point cost × vega per leg each way and 2 bp per hedge trade, not measured spreads.
- Where the model prices are known to differ from the exchange, the page says so under the table. EUA carbon structures are marked unreliable: the model prices EUA options against the monthly futures, while they exercise into the December future. WTI crude prices are a smooth smile fit, about 3% from the settlement on listed strikes and more in the wings.
- Days without model prices are listed as “Not priced”, and the trade on the day can be “Not available on this day”.
- Front-month (M1) changes never span a contract roll. Constant-maturity buckets are interpolated between listed expiries.
- Correlation pairs have no structures and no similar-surface link.
- A level band is not a Radar signal: its cases are entries into a level range, not detector events.
- The number of events in C can differ slightly from the analog count on the Radar card (51 against 49 for the example): they are counted separately.
Related
- Radar: daily discoveries
- Tutorial: from a Radar alert to a trade idea
- Surface report
- History: similar past surfaces
- Test My Scenario
- Vol Radar API: the same signals, outcomes and structures as JSON