

Before you start
Open it from Test My Scenario → in either place:- the header of section D (Explore structures) of an investigation, for a signal;
- the header of Explore structures after the similar days on History.
Steps
1
Read the market context
Section A shows the day, the reference futures price (the future of the front option), 30D ATM IV, the 25-delta
risk reversal, the 30D − 180D term spread and 20-day realised vol.
2
Define your scenario
Section B: the futures move in % (or a target price, kept in step), the ATM IV change and the skew change in
vol points, and the holding period. Choose the risk filter, the hedge, the expiry, the costs and the structures.
3
Calculate
Click Calculate scenario P&L. Nothing is priced before you click; the page address then holds your scenario,
so you can share the link.
4
Compare and open a structure
Section C lists the structures. Click Details for its legs, then the copy button there to take the exact
trade (contracts, strikes, sides, quantities, pricing date and your scenario) to Allasso Trade.
Settings
How the scenario is applied
- Futures: every leg’s own future moves by the same percentage, a parallel shift of the curve.
- Smile: each expiry keeps its smile as a function of moneyness ln(K/F), moved with its future.
- ATM IV: the change is added to every point of the smile.
- Skew: the change is spread by delta: +½ at 25C, −½ at 25P, none at ATM, +0.8 at 10C. The risk reversal moves by exactly your input.
- Time: the scenario is valued N weekdays later; exchange holidays are not removed. Expiries before the horizon are never used.
- Pricing: Black-76 on model prices, the same as the investigation page’s structures. A shocked vol under 1% is not priced: the structure is listed as excluded, with the reason.
- P&L: scenario value − initial value − costs (+ the static hedge), per unit of the underlying and per one structure (each leg × its contract size), in the market’s currency.
Reading the result
- Summary: the number repriced, how many have a positive scenario P&L, the best defined-risk structure per unit of maximum loss, and any exclusions.
- Scenario columns (shaded): value, P&L per unit, P&L in currency, and P&L ÷ max loss.
- Max loss at expiry per unit where defined; unbounded structures are marked.
- History columns: what the same structure did after the earlier cases: the earlier signals like this one (from an investigation, the most recent 20) or the similar days (from History). They answer a different question from the scenario, and neither is a prediction.
- Order: defined-risk structures first, by scenario P&L per unit of maximum loss; unbounded ones after, by scenario P&L, whatever their P&L. Click a column title to sort.
- Details: each leg’s option expiry, future, strike, contract size, and its future, IV, price and delta now and in the scenario; Greeks now and then; max loss and breakevens at expiry.
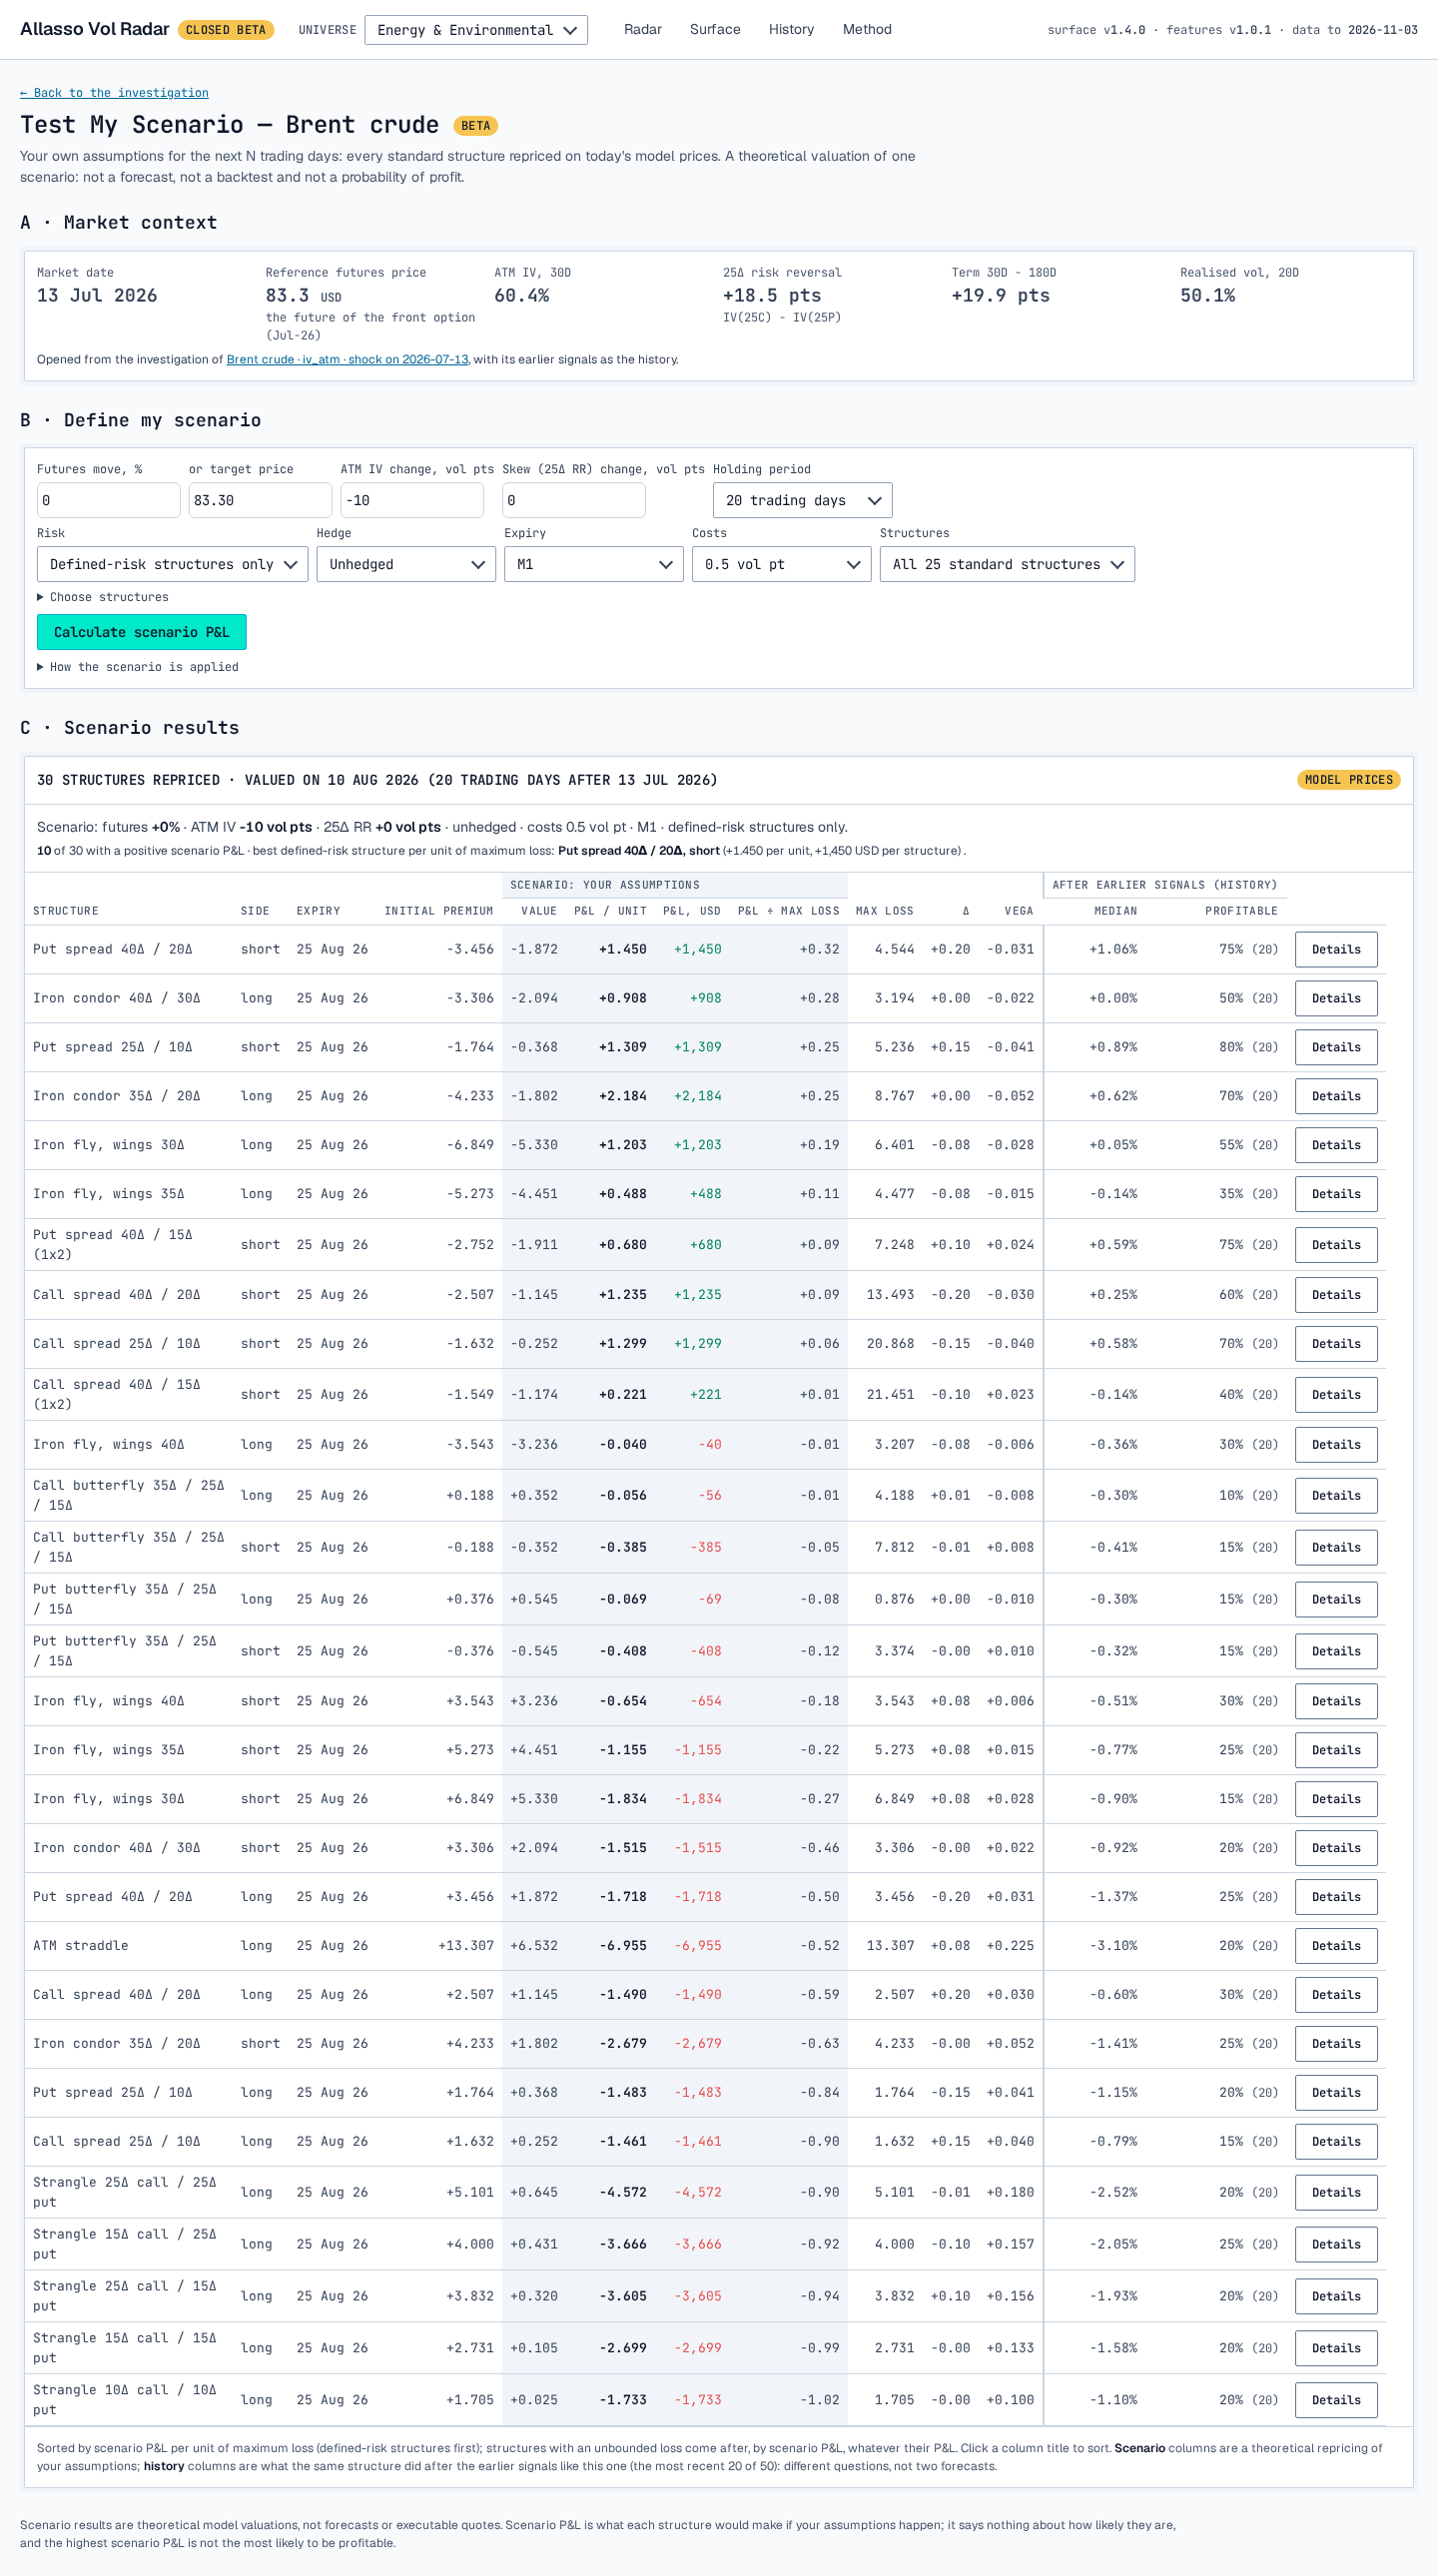
Brent crude, 13 Jul 2026, opened from the ATM vol shock: ATM IV −10 vol pts over 20 trading days, defined-risk structures.
Example
From the Brent crude ATM implied vol shock of 13 Jul 2026, with ATM IV −10 vol pts, no futures move and no skew change over 20 trading days: 30 defined-risk structures are repriced, valued on 10 Aug 2026; 10 have a positive scenario P&L. The short 40Δ / 20Δ put spread ranks first per unit of maximum loss: +1.450 per unit, +1,450 USD per structure, 0.32 of its maximum loss.Limitations
- One deterministic scenario: no probability of profit. The highest scenario P&L is not the most likely to be profitable.
- Model prices on a fitted smile grid, not exchange settlements or executable quotes.
- The same percentage move for every futures maturity; the smile’s shape otherwise unchanged.
- An exchange holiday inside the holding period counts as a trading day.
- The hedge is static: a single end-state has no price path to rebalance a dynamic hedge on.
- Calendars span two expiries, so they have no single payoff at expiry and never count as defined risk.