

When to use it
- Each morning, to see which markets moved out of their usual range in the last session.
- To go back to a past day and see what the Radar showed then, with no hindsight.
- To check where a market’s vol, skew, term structure and futures curve sit against their own five years, flagged or not.
Before you start
The Radar covers every market in Vol Radar, and the market pairs between them:Steps
1
Pick a day
Open Radar. Use the Date picker, or click a session in the day strip. Each session shows its count of notable and watch discoveries.
2
Narrow the markets
Choose a Universe in the header and a Market in the filter. Use All, Notable or Watch to filter discoveries by tier.
3
Read the discoveries
Scan the cards from the top: they are ranked by severity, then rarity. Open Details for the reference and the method.
4
Investigate
Click a card or Investigate → to open its move page. Or click any cell under Where each market stands.
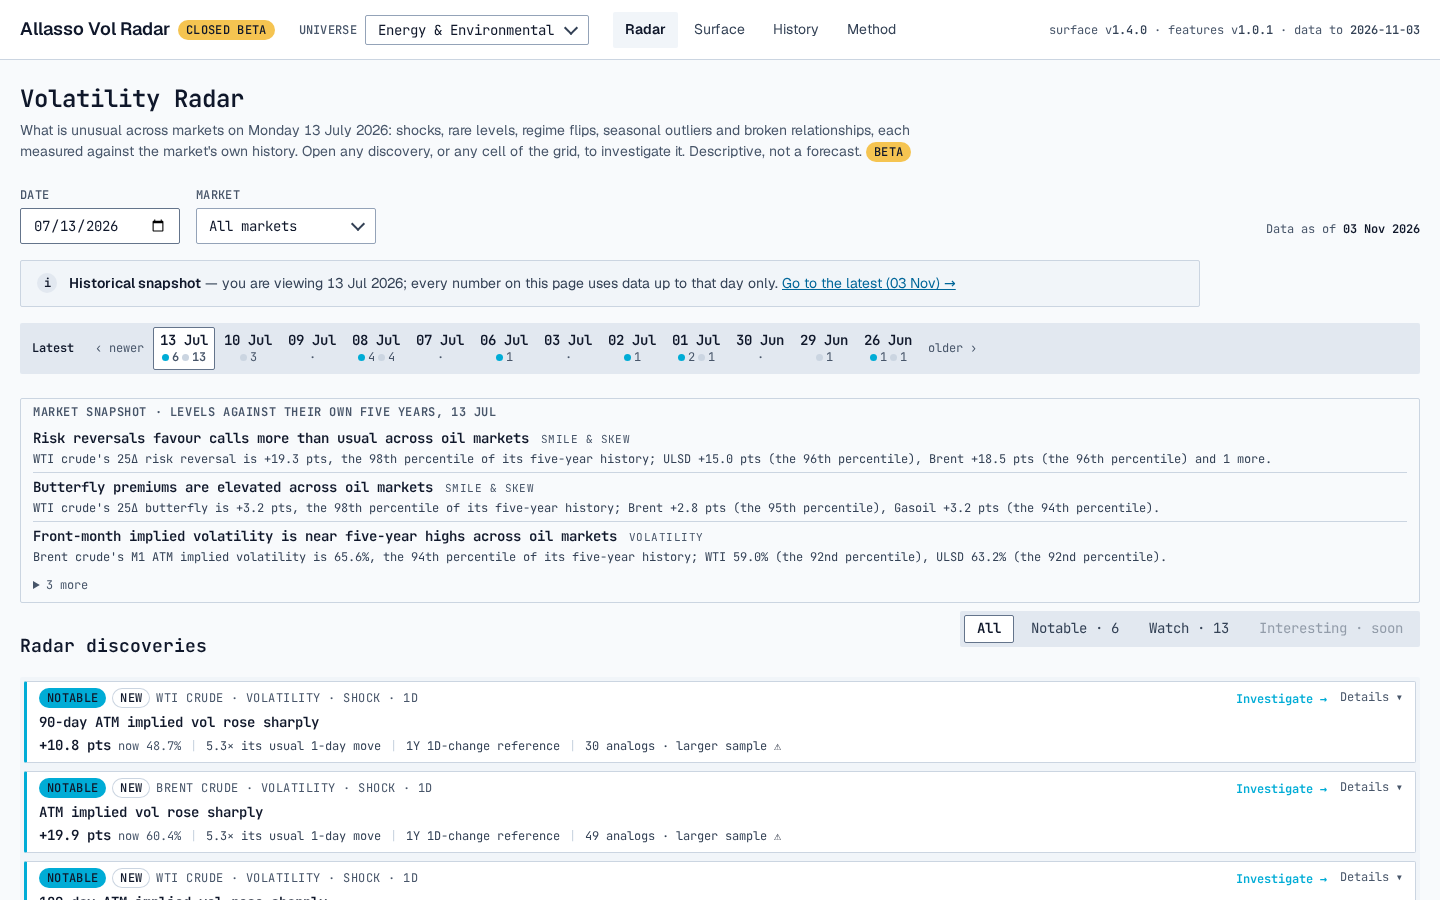
Radar on 13 Jul 2026, all markets: the day strip, the market snapshot and the first discoveries.
Settings
When you view a past day, a Historical snapshot banner says so. Every number on the page then uses data up to that day only. Go to the latest returns to the newest session. Data as of shows the newest day in the data.
Reading the result
Market snapshot
The snapshot lists up to six readings that sit far from their five-year median, at or beyond the 90th or 10th percentile. It picks one per family (vol level, implied vs realised, skew, wings, vol term, futures curve, realised vol). Markets of the same sector that share the reading are combined in one line. The first three are shown and the rest open under more. A line about one market opens its move page. Days that failed a data-quality check are left out.Radar discoveries
Each card is one signal that started or escalated that day.- Tier: NOTABLE or WATCH. See the thresholds below.
- Status: NEW (first detected today) or ESCALATED (an open signal got more extreme; the card adds “since” its start date).
- Header: market · category · signal type, with the horizon for shocks (for example “Shock · 1D”).
- Line 3: the change (shocks) or the level, how rare it is, the reference window, and the analog count with its sample label.
- ⚠: the signal carries a quality flag. Hover it, or open Details.
- Type: EVENT (a new move or a new extreme) or REGIME (a persistent configuration), with what keeps the signal open. Flips and seasonal signals are always REGIME. An extreme or correlation signal becomes REGIME after 20 sessions open.
- Reference, Metric and Detector: what it was compared with, the metric’s definition and the detector’s sentence.
- Historically: with 5 or more analogs, the median change over the next 20 sessions in ATM vol, or in the futures price for futures-price and futures-curve signals. Not a forecast.
- Detected, Data quality and Provenance: the dates, any quality flags, and the detector version and signal key.
Ongoing signals
Signals still open with nothing new that day sit in a collapsed panel under the cards: “N ongoing signals · N re-flagged today · N escalated”. Click Show to see each signal’s market, since date, duration, peak severity, type and what keeps it open (hover Continues for the exact exit rule). re-flagged means the detector fired again after its cooldown, but the condition never stopped, so it is the same signal.Where each market stands
The grid shows every market’s value for each metric of the chosen category, flagged or not.- Shade and p: the value’s percentile within the market’s own trailing five years (1,260 sessions, up to the selected day). p99 means higher than 99% of days. The colour shows the position, not whether the value is flagged.
- ×: the last day’s move in multiples of its usual daily move over the trailing year, shown from 2×.
- ● a notable signal is active, ○ watch, ▲ escalated today. A small number means several signals on that metric.
- Outlined cell: no signal, but the level is in the top or bottom 10% of its five years. Its move page shows what followed earlier entries into that band (a level band, not a Radar signal).
- n/a: not supported (no listed options). short: under a year of history. —: no observation that day. ⚠ QC: the day failed a data-quality check.
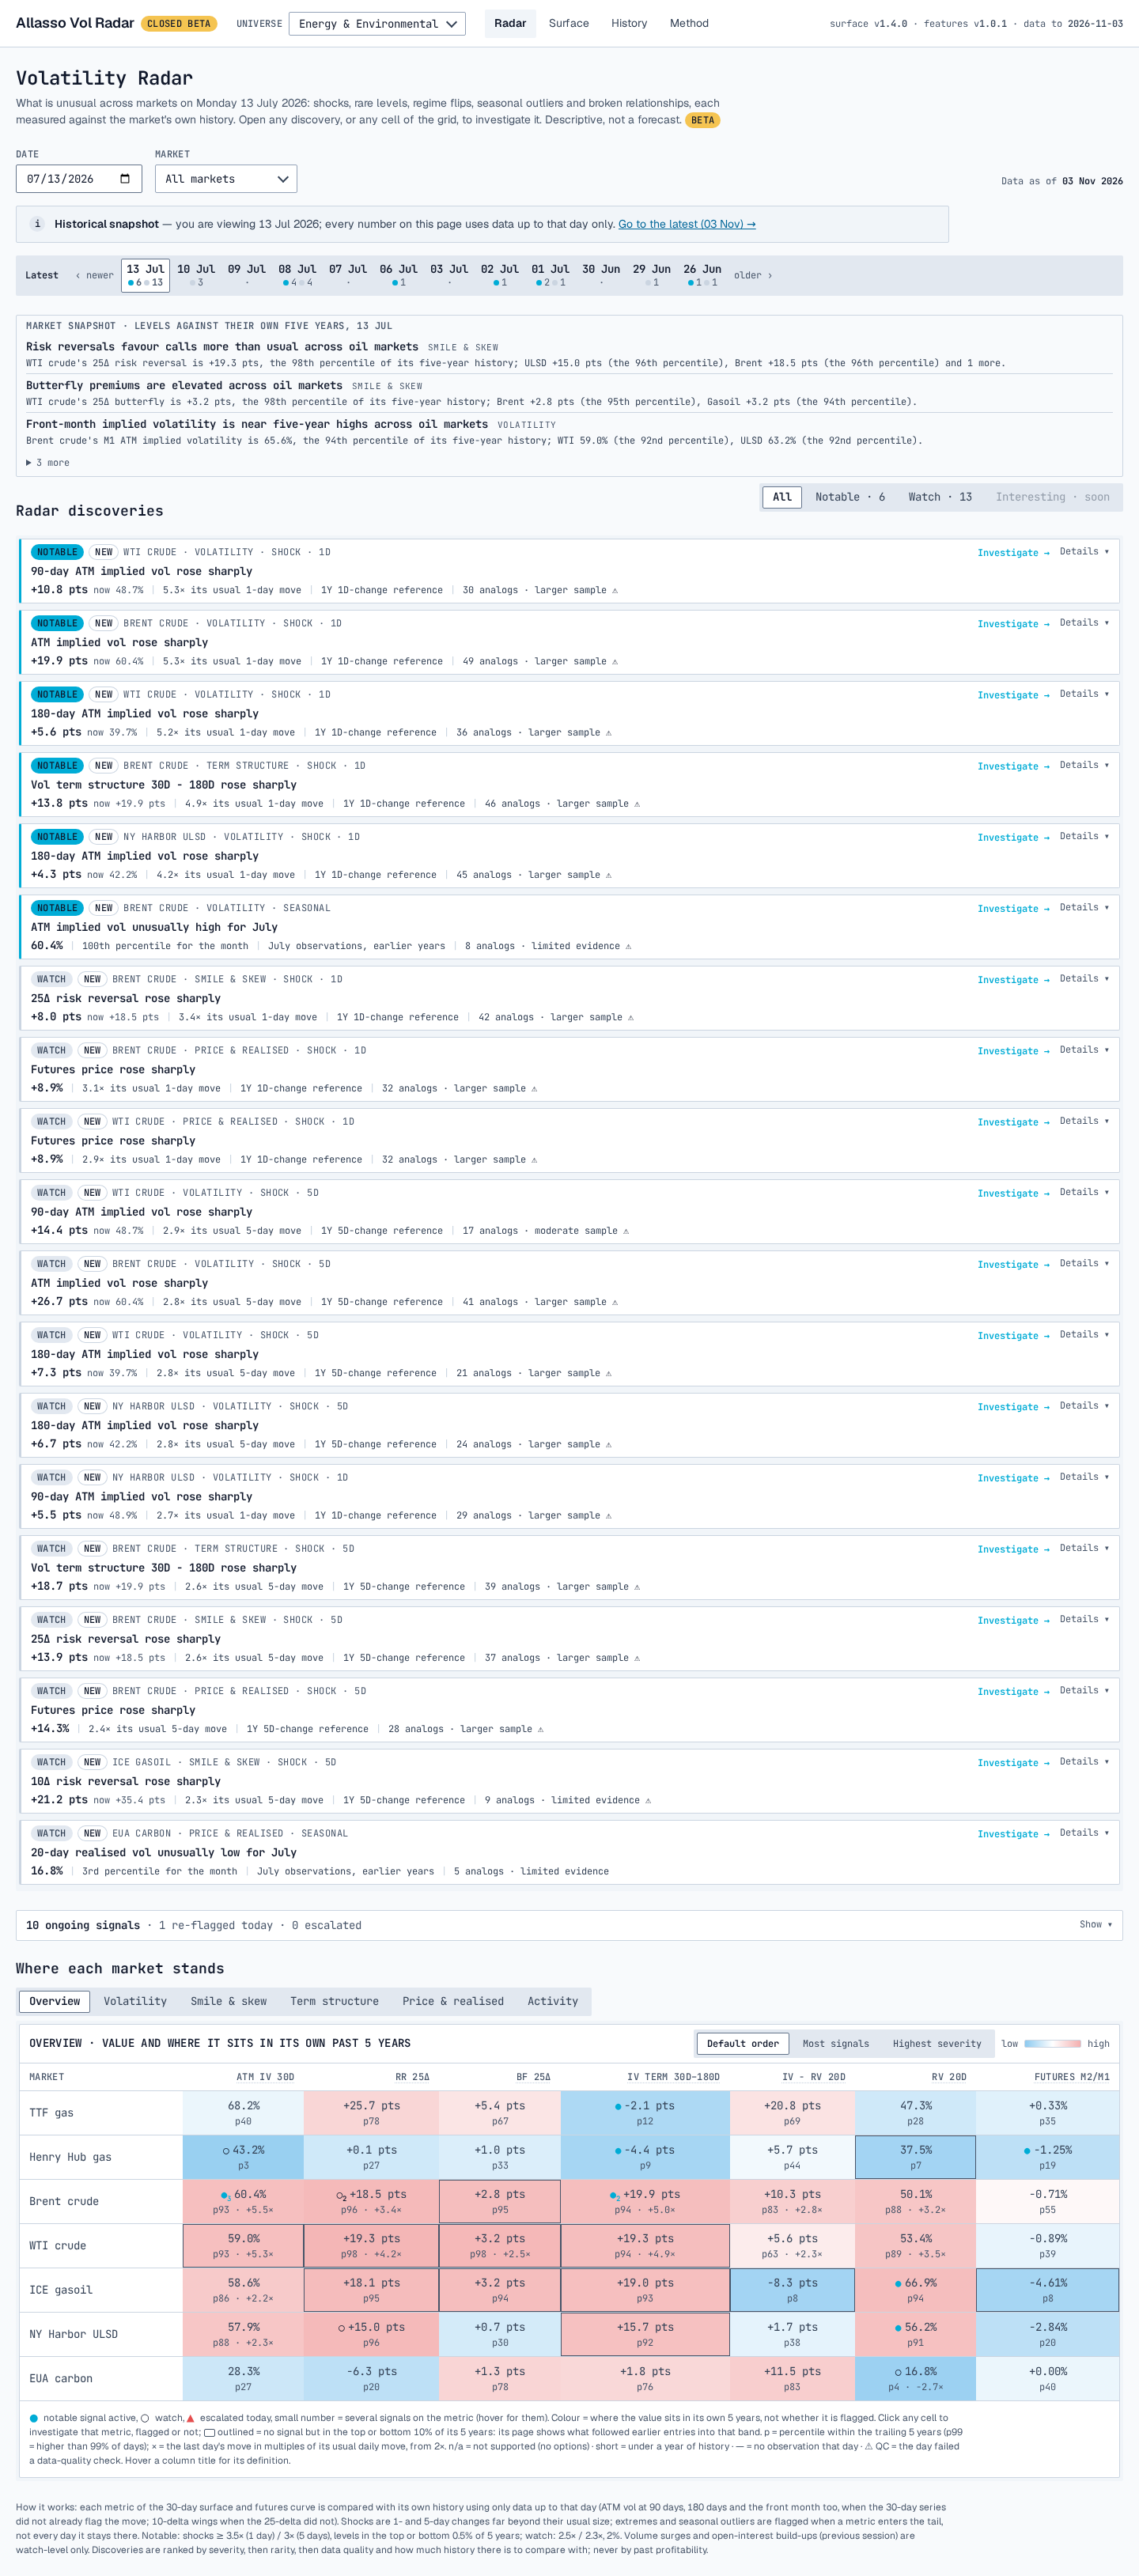
Where each market stands on 13 Jul 2026 (Overview), below the ongoing-signals panel.
Signal types and thresholds
The Radar reads the 30D constant-maturity surface and futures curve, so days stay comparable through time. Values come from radar version 1.3.0.What is watched
Two rules stop the same move from being shown twice:
- A 10-delta signal is shown only when the 25-delta metric did not flag the same kind and direction that day.
- ATM vol is also watched at 90D and 180D (shock, extreme) and M1, the front listed option (shock only). These are shown only when the 30D series did not flag the same kind and direction that day. M1 changes never span a contract roll.
How signals are classified
A 5-day shock fires once per move, not again while the same-direction change stays unusual. A 1-day shock is a new move each day.
A flip needs a minimum size, both for the new value and (at half that size) for the recent median: 1 vol pt for the 25-delta risk reversal, 2 vol pts for the 10-delta risk reversal and the vol term structure, 0.4% for the M2 vs M1 curve and 1% for the 180D vs 30D curve.
Correlation pairs: Brent crude–WTI crude, TTF gas–EUA carbon, TTF gas–Henry Hub gas, Brent crude–ICE gasoil, ICE gasoil–NY Harbor ULSD.
Activity signals use the session’s numbers, published the next morning:
- Volume: the session’s volume against its trailing 20-session median, with that ratio in its top 1% of the past year (252 sessions; needs 126).
- Open interest: a 5-session build-up of at least 3.0× the usual 5-session change over the trailing year.
Lifecycle: how long a signal stays open
A signal opens at the watch threshold and closes only below a lower exit threshold. A value hovering at the boundary is one signal, not a string of new ones.
An open signal escalates when its tier rises from watch to notable, or when it beats its peak by a clear step: 0.5 in normal-quantile units for percentile signals, 1.0× for shocks. A signal that returns within 20 sessions of closing reopens as the same signal.
Quality flags
Discoveries come only from days that passed the data-quality checks. A card can still carry these flags (⚠):- IV interpolated between listed expiries: the 30D value sits between two listed expiries.
- day passed the checks with a warning.
- under 60% of the usual reference history: for example, fewer than 151 of the usual 252 past changes for a shock.
Example
Brent crude, 13 Jul 2026 (/radar?d=2026-07-13&market=BRENT). The tier buttons read Notable · 3 and Watch · 6. The top card reads:
NOTABLE · NEW · Brent crude · Volatility · Shock · 1D ATM implied vol rose sharply +19.9 pts now 60.4% | 5.3× its usual 1-day move | 1Y 1D-change reference | 49 analogs · larger sample ⚠The 5.3× is above the 3.5× notable threshold for a 1-day shock. The ⚠ shows two flags: IV interpolated between listed expiries, and a day that passed the checks with a warning. Details adds: “After 49 earlier moves like this, ATM vol over the next 20 days changed by a median -2.8 pts (37% higher). Not a forecast.” Brent’s ATM IV 30D cell in the grid reads 60.4%, p93.
Limitations
- The Radar is descriptive, never a forecast. Context lines describe what followed earlier moves, not what will follow this one.
- Activity signals use the previous session’s volume and open interest, and are watch-level only.
- An outlined grid cell is a level band, not a signal: it is not ranked, counted or listed as a discovery.
- A cell with under a year of history shows short. A grid cell under 1,000 sessions, or a signal flagged “under 60% of the usual reference history”, ranks against a thinner past.
- The grid’s × is computed on the grid’s own daily series, so it can differ slightly from a shock card’s score for the same move (5.5× against 5.3× for the example).
- The analog count on a card and the event count on its move page are counted separately, so they can differ by a few (49 against 51 for the example).