

Strategy. This shows the main ways to read it: the Stats summary,
the chart catalogue, the self-contained HTML report, and a trades DataFrame for custom analysis. See
Metrics and Stats for what the numbers mean.
from pulse import Strategy, run_sequentially, InstrumentType, PeriodType, PeriodID
import pulse.charts as pcharts
import plotly.io as pio

pio.renderers.default = "notebook_connected"


class ShortPut(Strategy):
    def __init__(self):
        super().__init__(name="Short Put", underlying_id="COM.BRN")

    def on_update(self):
        if self.has_open_trades:
            return
        u = self.underlying_id[0]
        expiry = self.resolver.expiry.relative(
            underlying_id=u, as_of_time=self.last_pulse, period_type=PeriodType.MONTH,
            instrument_type=InstrumentType.PUT, nth=1, period_id=PeriodID.ALL, min_dte=30)[0]
        strike = self.resolver.strike.delta.resolve(
            underlying_id=u, as_of_time=self.last_pulse, expiration_date=expiry,
            instrument_type=InstrumentType.PUT, strike_value=0.30)
        self.sell(u, InstrumentType.PUT, expiry, strike, 1, is_lots=True)


strategy = run_sequentially([ShortPut()], initial_equity=1_000_000)[0].strategy
Stats
TheStats object summarises returns, risk-adjusted ratios, drawdown and trade statistics.
print(strategy.stats)
Output
Strategy Metrics:
Start Date: 				2015-02-02 00:00:00
End Date: 				2026-06-02 00:00:00
Duration: 				4139 days, 0:00:00
***********************************************************
Total Return (%): 			3.87
CAGR (%): 				0.34
***********************************************************
Start Equity ($): 			1000000.00
End Equity ($): 			1038661.24
Diff ($): 				38661.24
***********************************************************
Annualized Sharpe Ratio: 		0.32
Calmar Ratio: 				0.00
Annualized Sortino Ratio: 		0.40
***********************************************************
Daily Mean Return (%): 			0.00
Daily Volatility annualized (%): 	0.07
Best Daily Return (%): 			0.44
Best Day Date: 				2015-08-27 00:00:00
Worst Daily Return (%): 		-1.11
Worst Day Date: 			2020-03-09 00:00:00
***********************************************************
Monthly Mean Return (%): 		0.03
Monthly Volatility annualized (%): 	1.05
Best Monthly Return (%): 		0.65
Best Month Date: 			2026-04
Worst Monthly Return (%): 		-2.33
Worst Month Date: 			2020-03
MTD Return (%): 			0.06
3-Month Return (%): 			0.84
Positive Months (%): 			77.21
Average Up Month (%): 			0.13
Average Down Month (%): 		-0.33
***********************************************************
6-Month Return (%): 			1.30
Year-to-Date Return (%): 		1.30
1-Year Return (%): 			1.54
Yearly Mean Return (%): 		0.44
Yearly Volatility annualized (%): 	1.22
… (32 more lines)
Charts
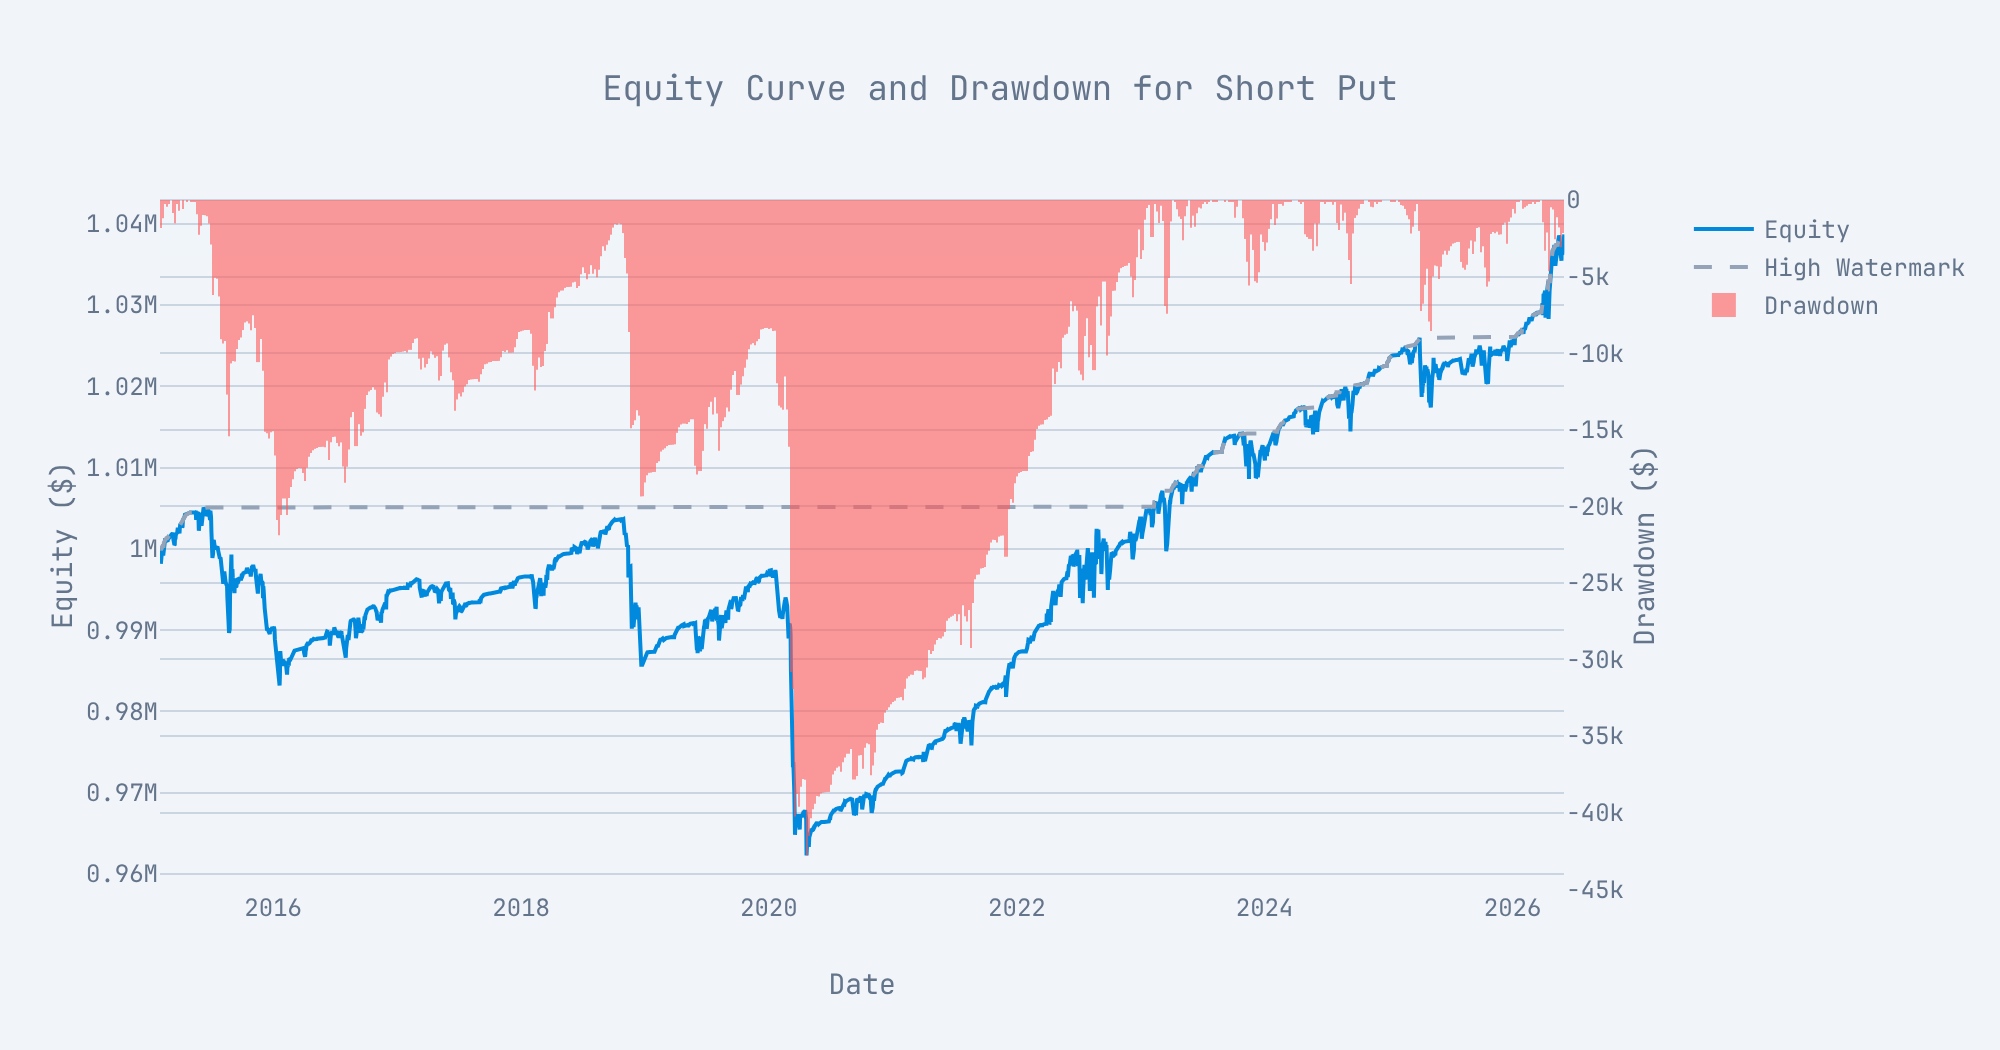
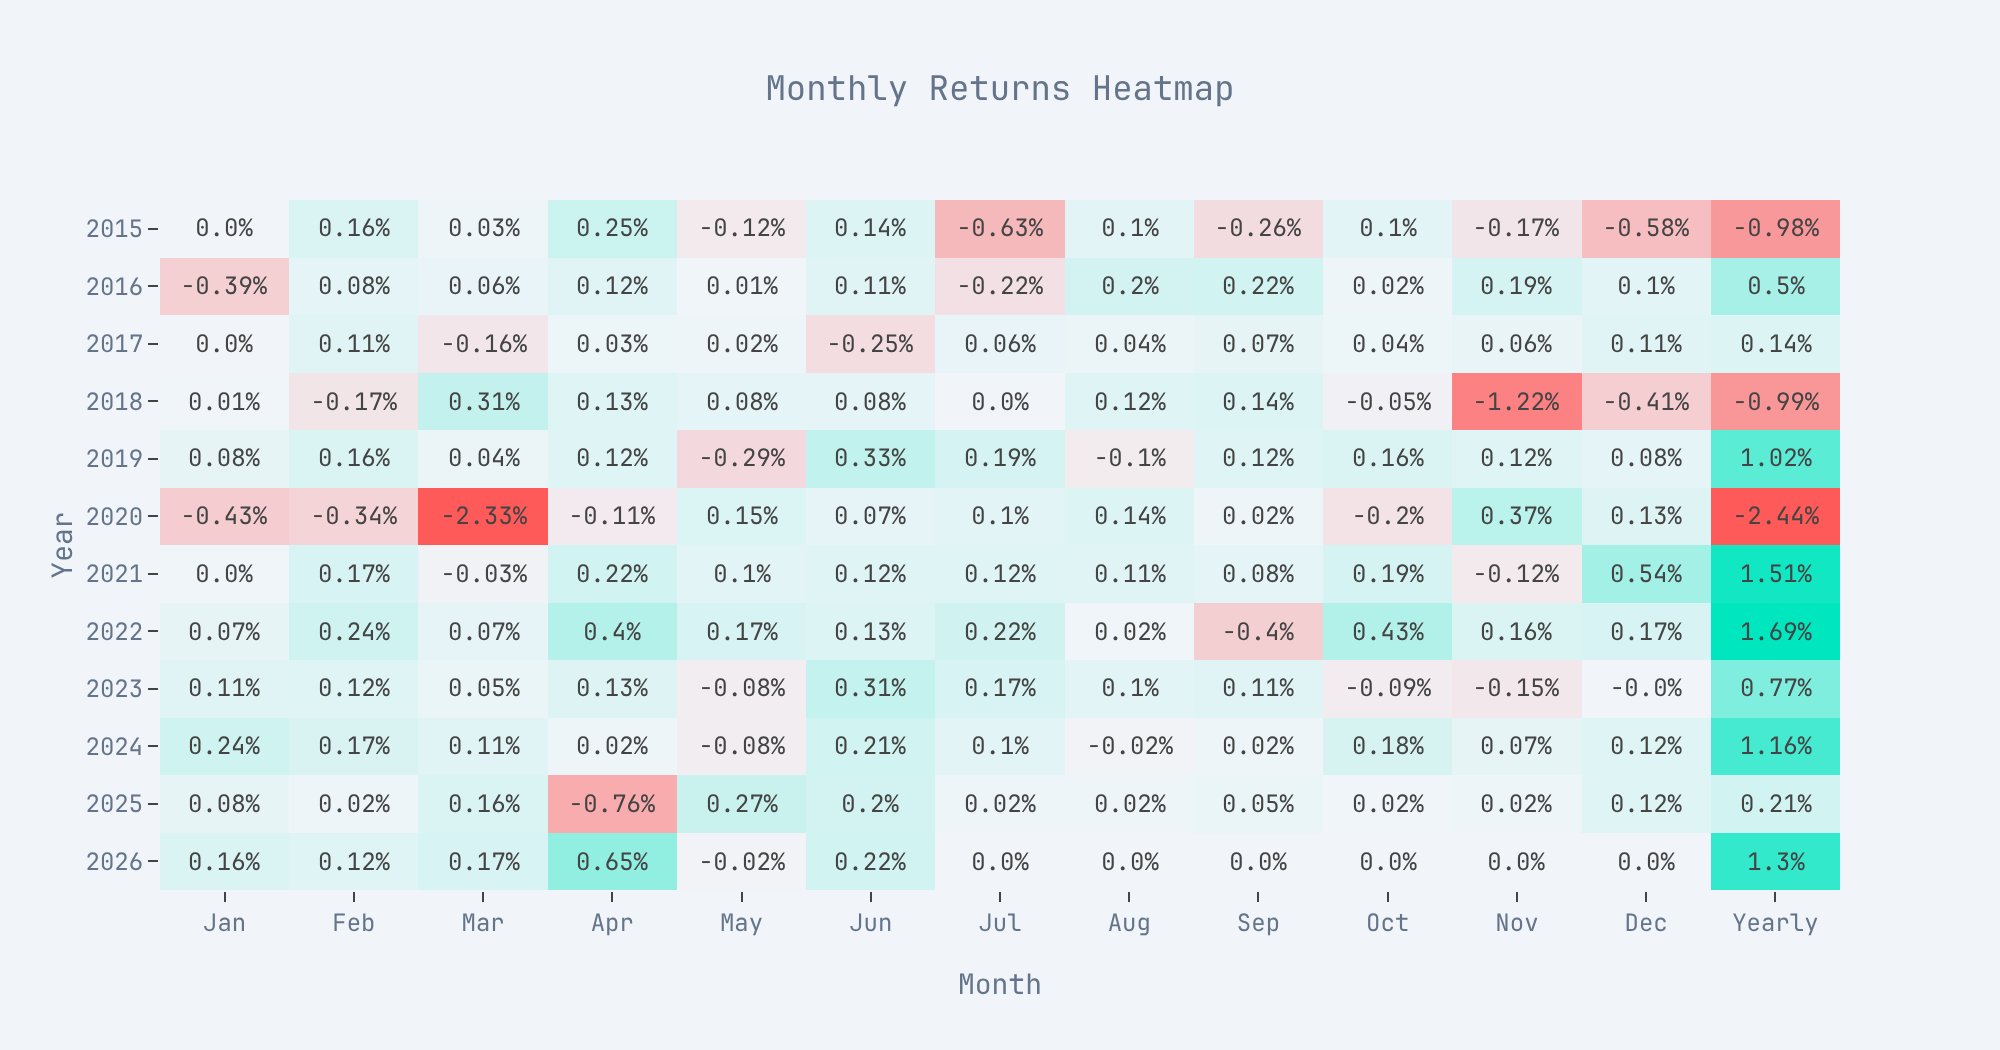
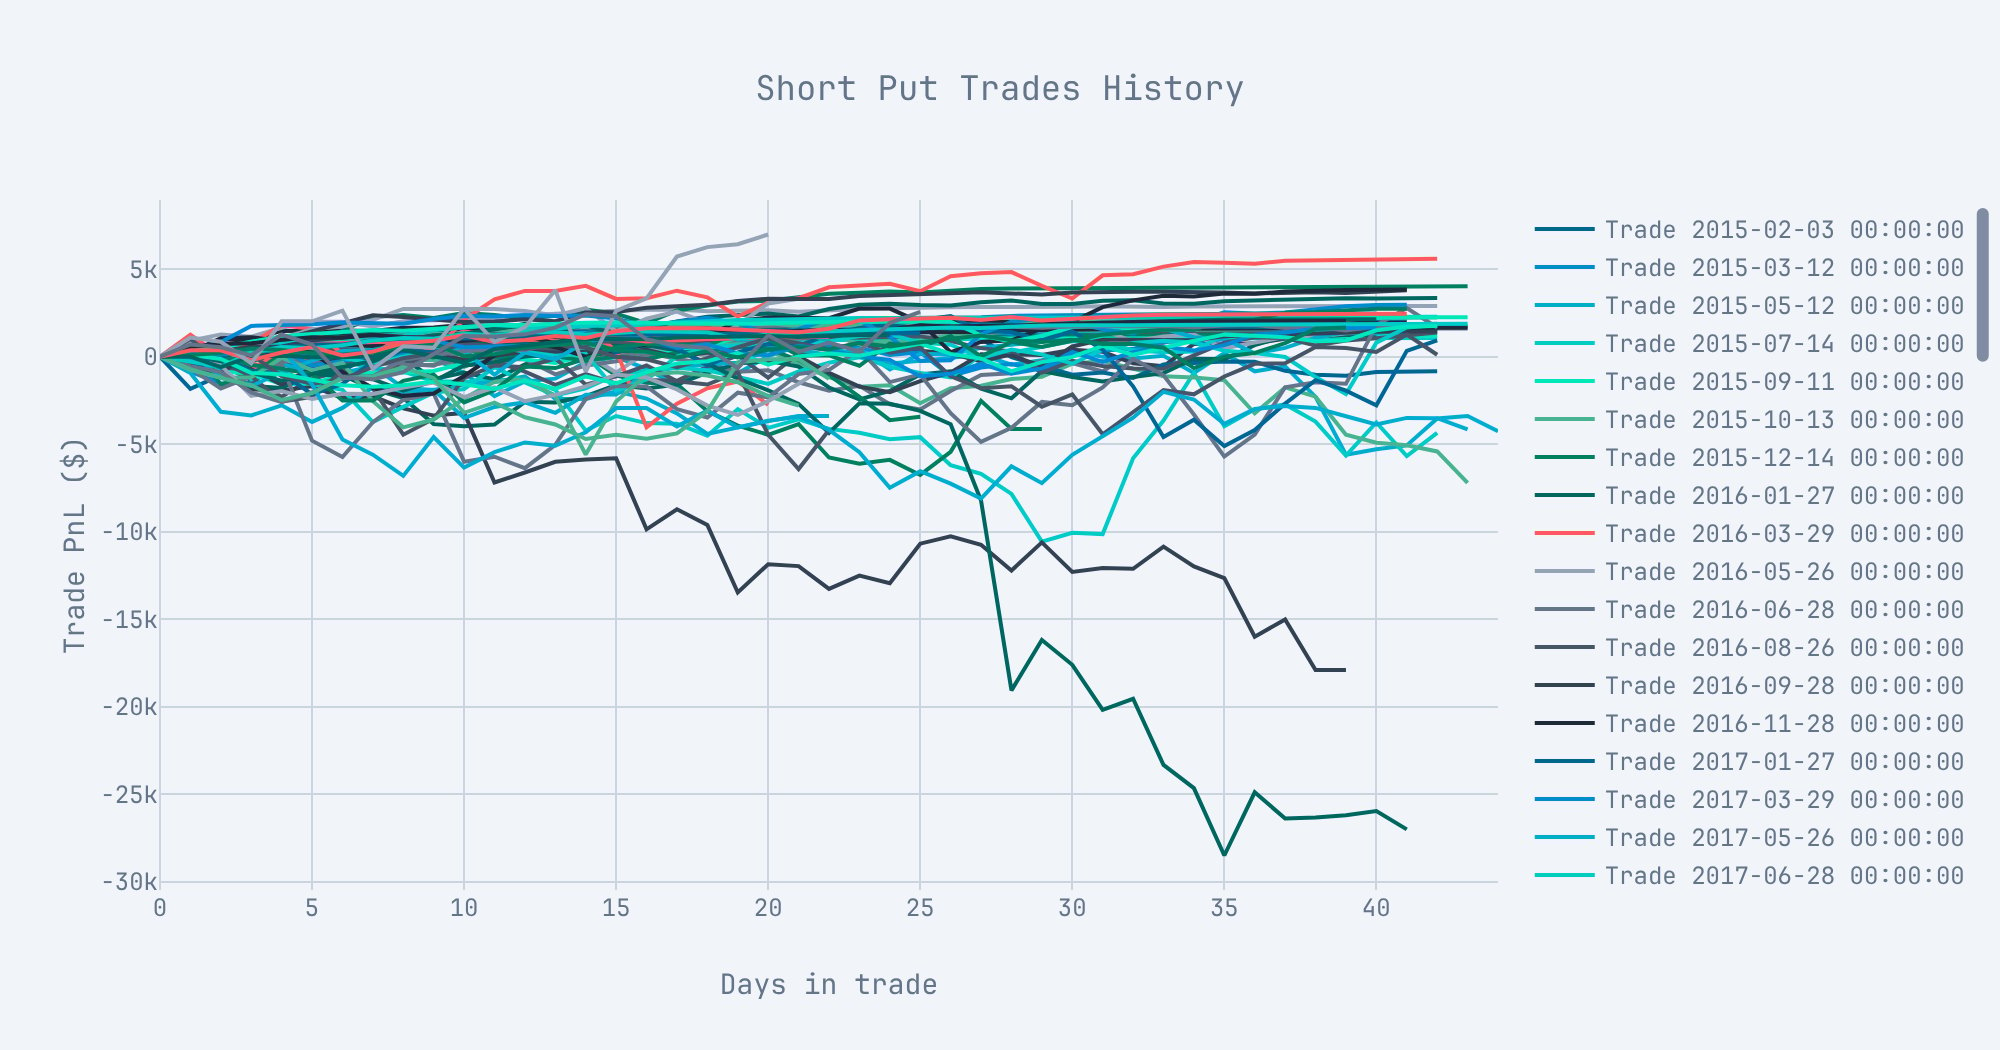
Everything inpulse.charts takes the finished strategy and returns a Plotly figure.
pcharts.plot_equity(strategy)
pcharts.plot_monthly_returns_heatmap(strategy)
pcharts.plot_trades_history(strategy)
HTML report
StrategyReport bundles the stats grid, the curated charts and a trades table into one self-contained
file. In Jupyter the object renders inline; report.show() opens it in a browser, and report.save(path)
writes a standalone .html.
import os
import tempfile
from pulse.report import StrategyReport

report = StrategyReport(strategy)            # plotly_mode="cdn" by default
path = os.path.join(tempfile.gettempdir(), "short_put_report.html")
report.save(path)
print("report written to", path)
Output
report written to /tmp/claude-501/short_put_report.html
Trades as a DataFrame
trades_to_dataframe turns the trade list into a pandas DataFrame for custom analysis (filter by tag, group, export).
from pulse.core.aggregate import trades_to_dataframe

df = trades_to_dataframe(strategy.trades)
print(df.shape)
df.head()
Output
(81, 49)
| trade_id | order_id | instrument | quantity | tags | fill_price | settlement_price_at_open | open_price | open_quantity | open_datetime | … | gamma_history | theta_history | vega_history | delta_contract_history | gamma_contract_history | theta_contract_history | vega_contract_history | set_quantity_after_pulse | trade_object | trade_serialized | |
|---|---|---|---|---|---|---|---|---|---|---|---|---|---|---|---|---|---|---|---|---|---|
| 0 | 9a962172-81d8-4ca0-b594-ceb92311ae53 | 9f4e8bb8-596d-4e87-b5c9-f7ac53bf2f31 | {‘id’: ‘COM.BRN|p|55.0|2015-03-11 00:00:00’, ’… | -1 | None | None | 2.012472 | 2.012472 | -1 | 2015-02-03T00:00:00 | … | [0.036606380149351025, 0.04017557841962116, 0… | [-0.046164855631495624, -0.055812098097297244,… | [0.0647016564798264, 0.06775651397177285, 0.06… | [302.8730778353861, 457.5249701588291, 369.648… | [-36.606380149351025, -40.17557841962116, -35… | [46.16485563149563, 55.812098097297245, 59.672… | [-64.7016564798264, -67.75651397177285, -66.25… | None | <Trade entry: 2015-02-03 00:00:00; exit: 2015-… | {‘trade_id’: ‘9a962172-81d8-4ca0-b594-ceb92311… |
| 1 | c7088265-da4b-405e-a19e-04a5377606d7 | 089e1a74-35a7-42d3-84c5-e712195cbf73 | {‘id’: ‘COM.BRN|p|54.0|2015-05-11 00:00:00’, ’… | -1 | None | None | 2.466594 | 2.466594 | -1 | 2015-03-12T00:00:00 | … | [0.03225650857530127, 0.035832776745792216, 0… | [-0.03229903824273594, -0.03472612500531826, -… | [0.08350800572287653, 0.08627478365710317, 0.0… | [312.98587870765004, 391.2075622736211, 424.26… | [-32.25650857530127, -35.832776745792216, -34… | [32.29903824273594, 34.726125005318266, 39.341… | [-83.50800572287653, -86.27478365710317, -84.3… | None | <Trade entry: 2015-03-12 00:00:00; exit: 2015-… | {‘trade_id’: ‘c7088265-da4b-405e-a19e-04a53776… |
| 2 | 50d17b03-8b24-4c30-85b8-bf8c1815e77d | 52002fc6-b016-469e-8dfc-7fc6e0571a4d | {‘id’: ‘COM.BRN|p|64.0|2015-07-13 00:00:00’, ’… | -1 | None | None | 1.893027 | 1.893027 | -1 | 2015-05-12T00:00:00 | … | [0.03892886013545649, 0.0391707999369828, 0.04… | [-0.025284432489934883, -0.02580894269596702, … | [0.09797106908280284, 0.0975503066072747, 0.09… | [305.1341474247238, 308.7216632025047, 322.877… | [-38.92886013545649, -39.1707999369828, -42.43… | [25.284432489934883, 25.808942695967023, 25.15… | [-97.97106908280284, -97.5503066072747, -97.86… | None | <Trade entry: 2015-05-12 00:00:00; exit: 2015-… | {‘trade_id’: ‘50d17b03-8b24-4c30-85b8-bf8c1815… |
| 3 | 9ce6583a-a403-4e37-9f22-8ff2f1d1bb8c | d18cc5cf-e731-4c57-90f7-ee24a1fa2f06 | {‘id’: ‘COM.BRN|p|55.0|2015-09-10 00:00:00’, ’… | -1 | None | None | 1.754489 | 1.754489 | -1 | 2015-07-14T00:00:00 | … | [0.038439367244791356, 0.04942162235010983, 0… | [-0.026095257860712946, -0.023823222572207682,… | [0.08055023425939112, 0.08343043475100842, 0.0… | [289.28920492887755, 342.47869706405254, 352.5… | [-38.439367244791356, -49.42162235010983, -48… | [26.095257860712945, 23.823222572207683, 25.13… | [-80.55023425939112, -83.43043475100842, -83.3… | None | <Trade entry: 2015-07-14 00:00:00; exit: 2015-… | {‘trade_id’: ‘9ce6583a-a403-4e37-9f22-8ff2f1d1… |
| 4 | f54bb288-b170-4eb8-90db-e465851525be | fcb230b9-413c-43a2-933a-eb259f22a6ed | {‘id’: ‘COM.BRN|p|46.0|2015-10-12 00:00:00’, ’… | -1 | None | None | 1.298987 | 1.298987 | -1 | 2015-09-11T00:00:00 | … | [0.05235911260115245, 0.06226091642247411, 0.0… | [-0.03628168848433221, -0.041876646286619405, … | [0.04910825487201009, 0.050179795899296664, 0… | [292.38030510470026, 386.29872875617366, 365.4… | [-52.35911260115245, -62.26091642247411, -58.0… | [36.281688484332214, 41.876646286619405, 45.03… | [-49.10825487201009, -50.179795899296664, -48… | None | <Trade entry: 2015-09-11 00:00:00; exit: 2015-… | {‘trade_id’: ‘f54bb288-b170-4eb8-90db-e4658515… |