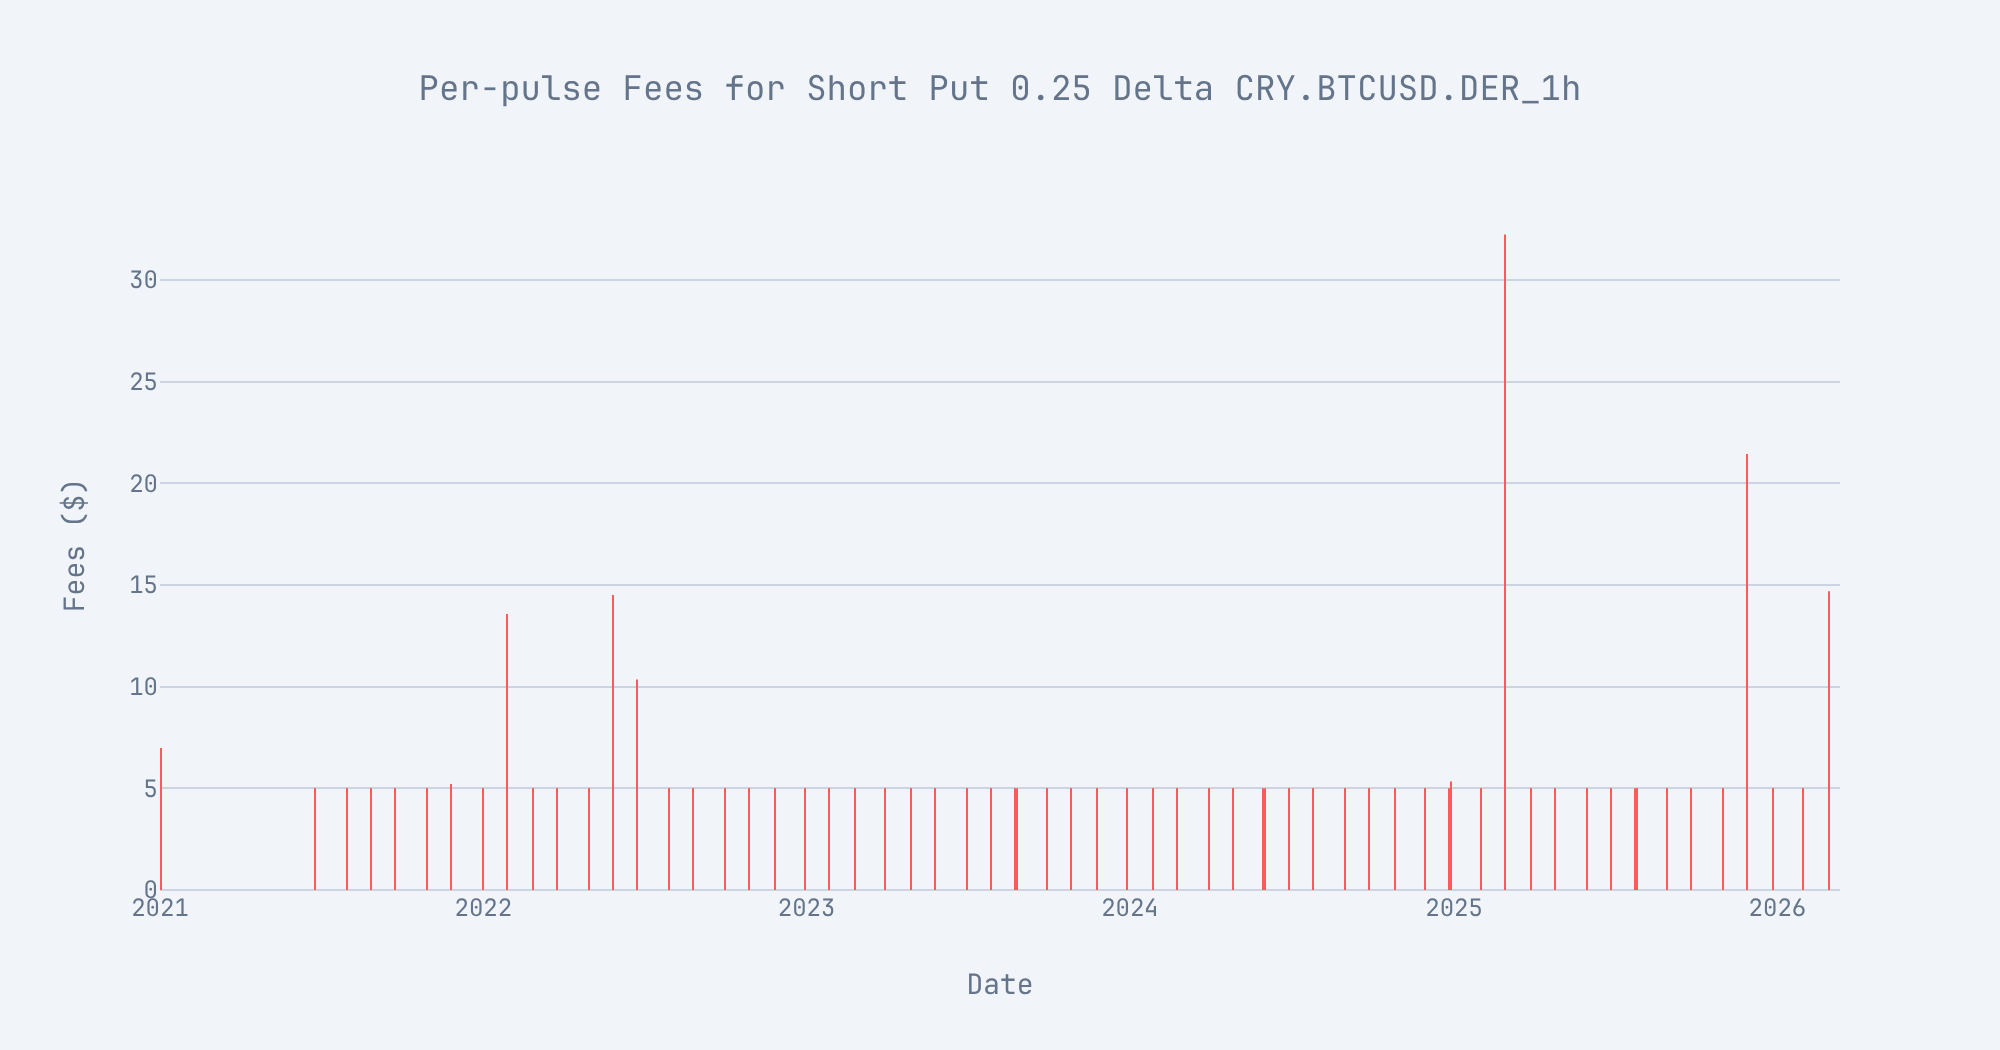
- Per-pulse fees over time (bar chart)
- Cumulative fees over time (line chart)
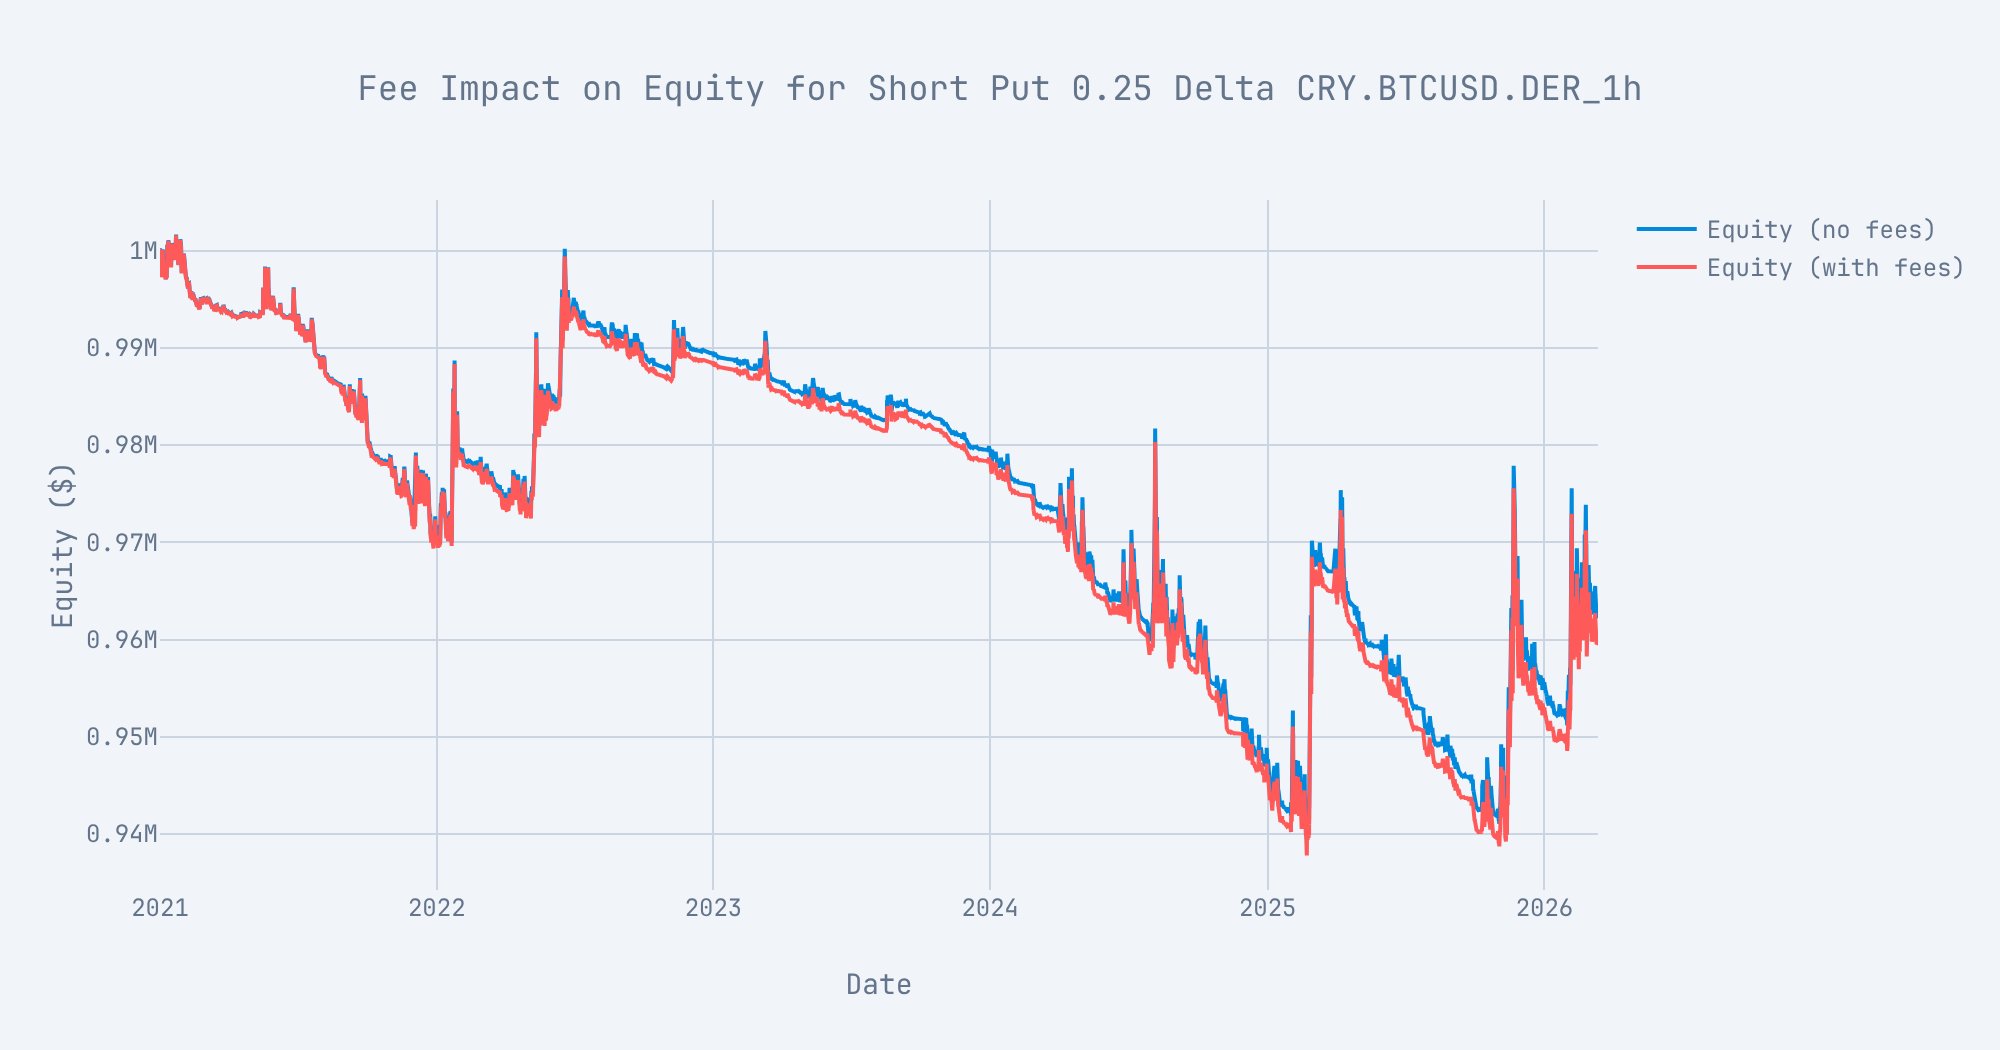
- Equity curves with and without fees (overlay)
pulse must be importable and PDC_PATH must point at the prepared market data before import pulse runs.
Imports
Strategy
Reuses theNakedOption short-put strategy from tests/functional/test_short_put_strategy.py. On every pulse where no trade is open it enters a front-month option at the configured delta, by resolving the front-month expiry/strike via self.resolver and calling self.buy(...).
Configuration
Tweak these values to see how the fee rate affects equity.FEE_RATE is applied to notional (|quantity_units| * |price|) on every entry / rebalance / exit event.
Run without fees (baseline)
With nofee_calculator argument, run_sequentially defaults to NoFeeCalculator() and portfolio.total_fees stays at zero.
Output
Run with PercentageFeeCalculator
Pass a fee calculator via the new fee_calculator kwarg. The portfolio now records every entry / rebalance / exit as a FeeEvent, drains them in a single batched FeeCalculator.calculate(events, datafeed) call per pulse, and deducts the total from equity at the end of the pulse.
Output
Summary
Output
Fee stats from Stats
The summary above pokes at portfolio.total_fees directly. The same numbers - and a few extras - are also available as a structured sub-object on Stats, alongside the existing Sharpe / drawdown / trade stats:
total_fees- cumulative fees charged across the runfee_drag_pct-total_fees / initial_equity(the headline drag number)avg_fee_per_trade- fees averaged acrosstrade_stats.position_countfees_pct_of_gross_pnl- fees as a share of gross alpha magnitude (≥100% means fees swallowed gross PnL)max_pulse_fees+max_pulse_fees_datetime- the single largest fee spike and when it happened
Output
Chart 1 - Per-pulse fees
portfolio.pulse_fees_history is aligned 1:1 with portfolio.datetimes. Spikes correspond to pulses where a trade was opened, rebalanced, or closed.
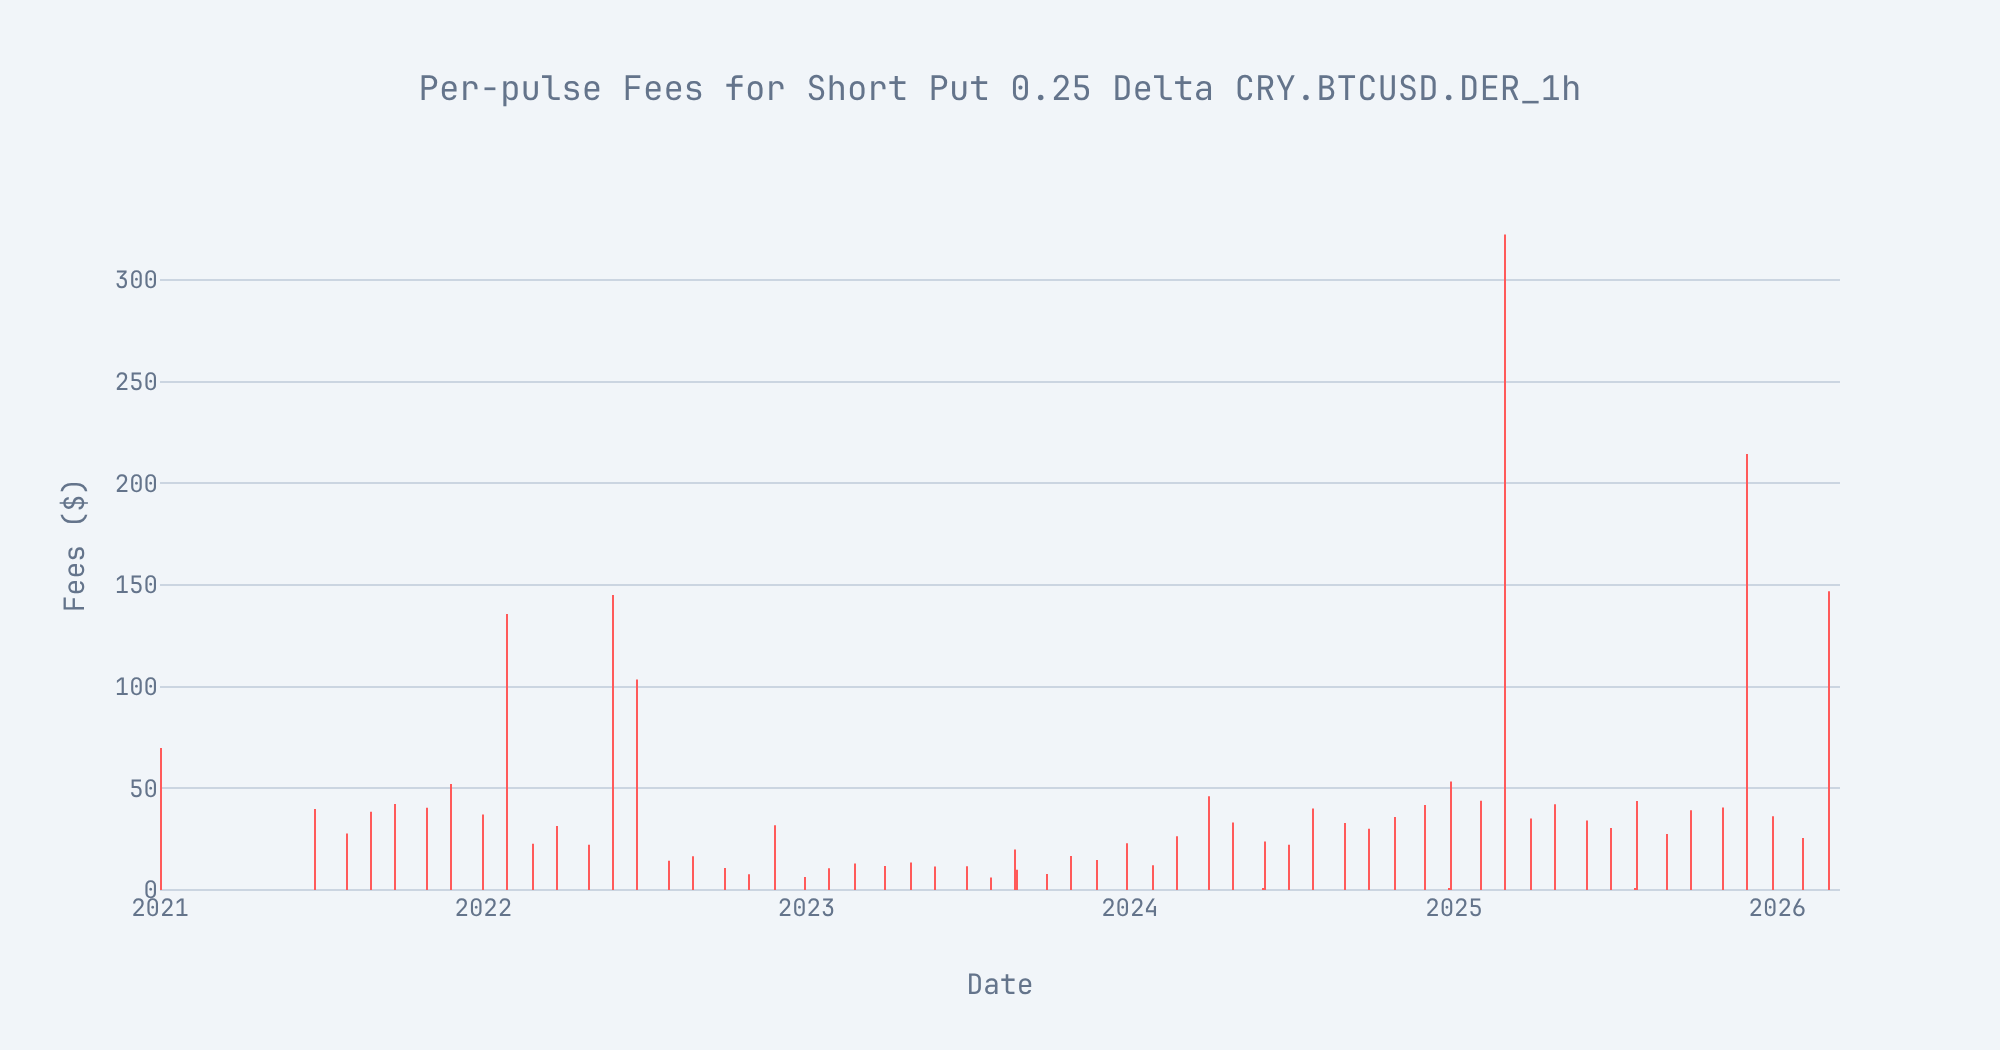
Chart 2 - Cumulative fees
Running sum ofpulse_fees_history. The terminal value equals portfolio.total_fees.
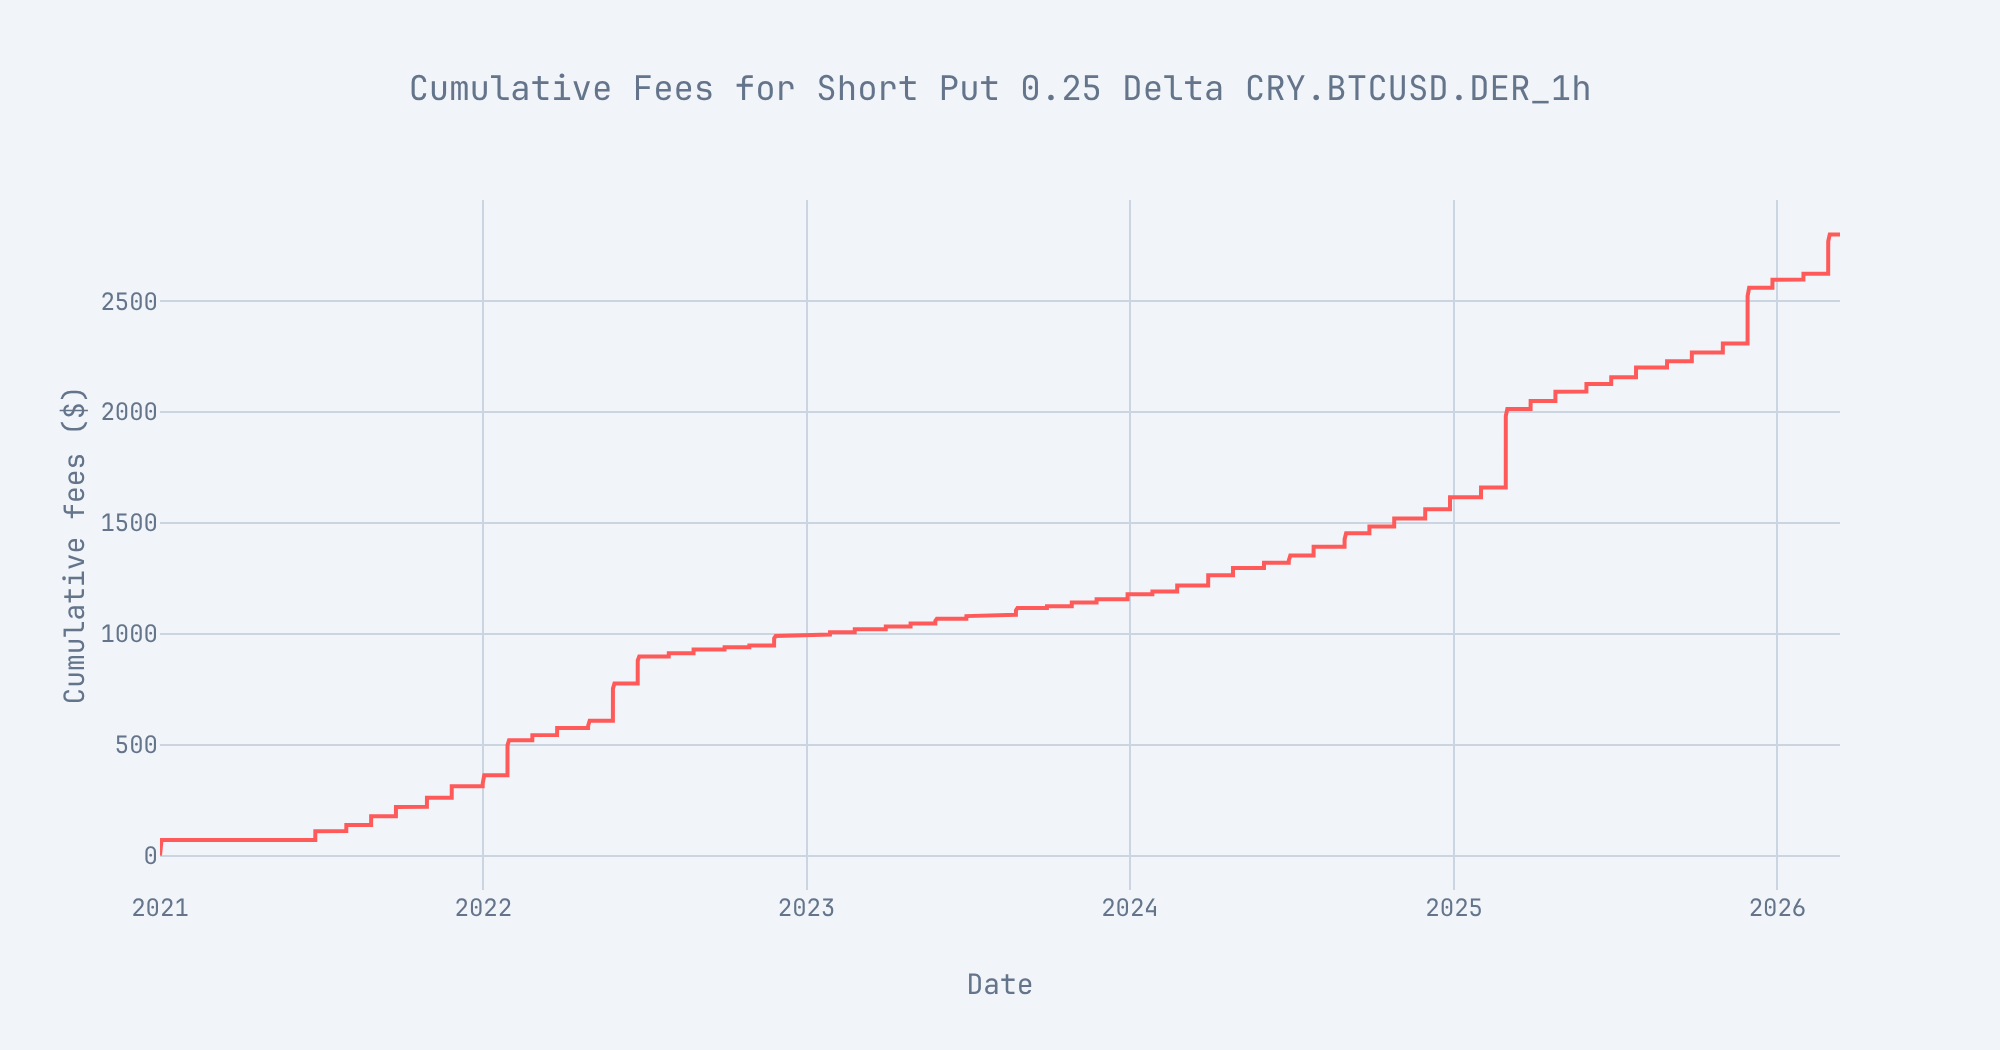
Chart 3 - Equity: with vs without fees
The no-fee curve is synthesised from a single strategy run asinitial_equity + cumsum(pulse_total_pnl_history) - pulse_total_pnl_history is the gross (pre-fee) per-pulse PnL, so adding it back gives the equity the strategy would have had without any fee charges. The gap between the two curves at the end equals portfolio.total_fees.
Custom example: minimum-fee floor
Both built-in calculators (FixedFeeCalculator, PercentageFeeCalculator) treat every event the same way. For anything more interesting - broker commissions, exchange tiers, block-trade pricing - subclass FeeCalculator directly.
Subclasses implement a single method:
FeeEvent carries:
trade- theTradebeing transactedquantity_units- signed quantity in units (lots already expanded)price- fill price of the transactionevent_type-FeeEventType.ENTRY,REBALANCE, orEXIT
max(floor, rate × |quantity_units| × |price|) per event. This is how Interactive Brokers (USD 1.00 floor) and tastytrade structure their options commissions - the floor binds for small trades, and percentage-of-notional dominates once the trade is large enough.
Run the strategy with the custom calculator
SameNakedOption short-put, same period - only the fee scheme changes. At FLOOR=$5 and RATE=0.1%, the floor binds on pulses where premium × quantity is small (below ~$5,000 notional), and the percentage component takes over for larger ones.
Output
Visualise the floor in action
The per-pulse bar chart makes the floor-vs-rate behaviour visually obvious - bars cluster at the floor amount on small-premium pulses and rise above it on large-premium pulses.