

Description
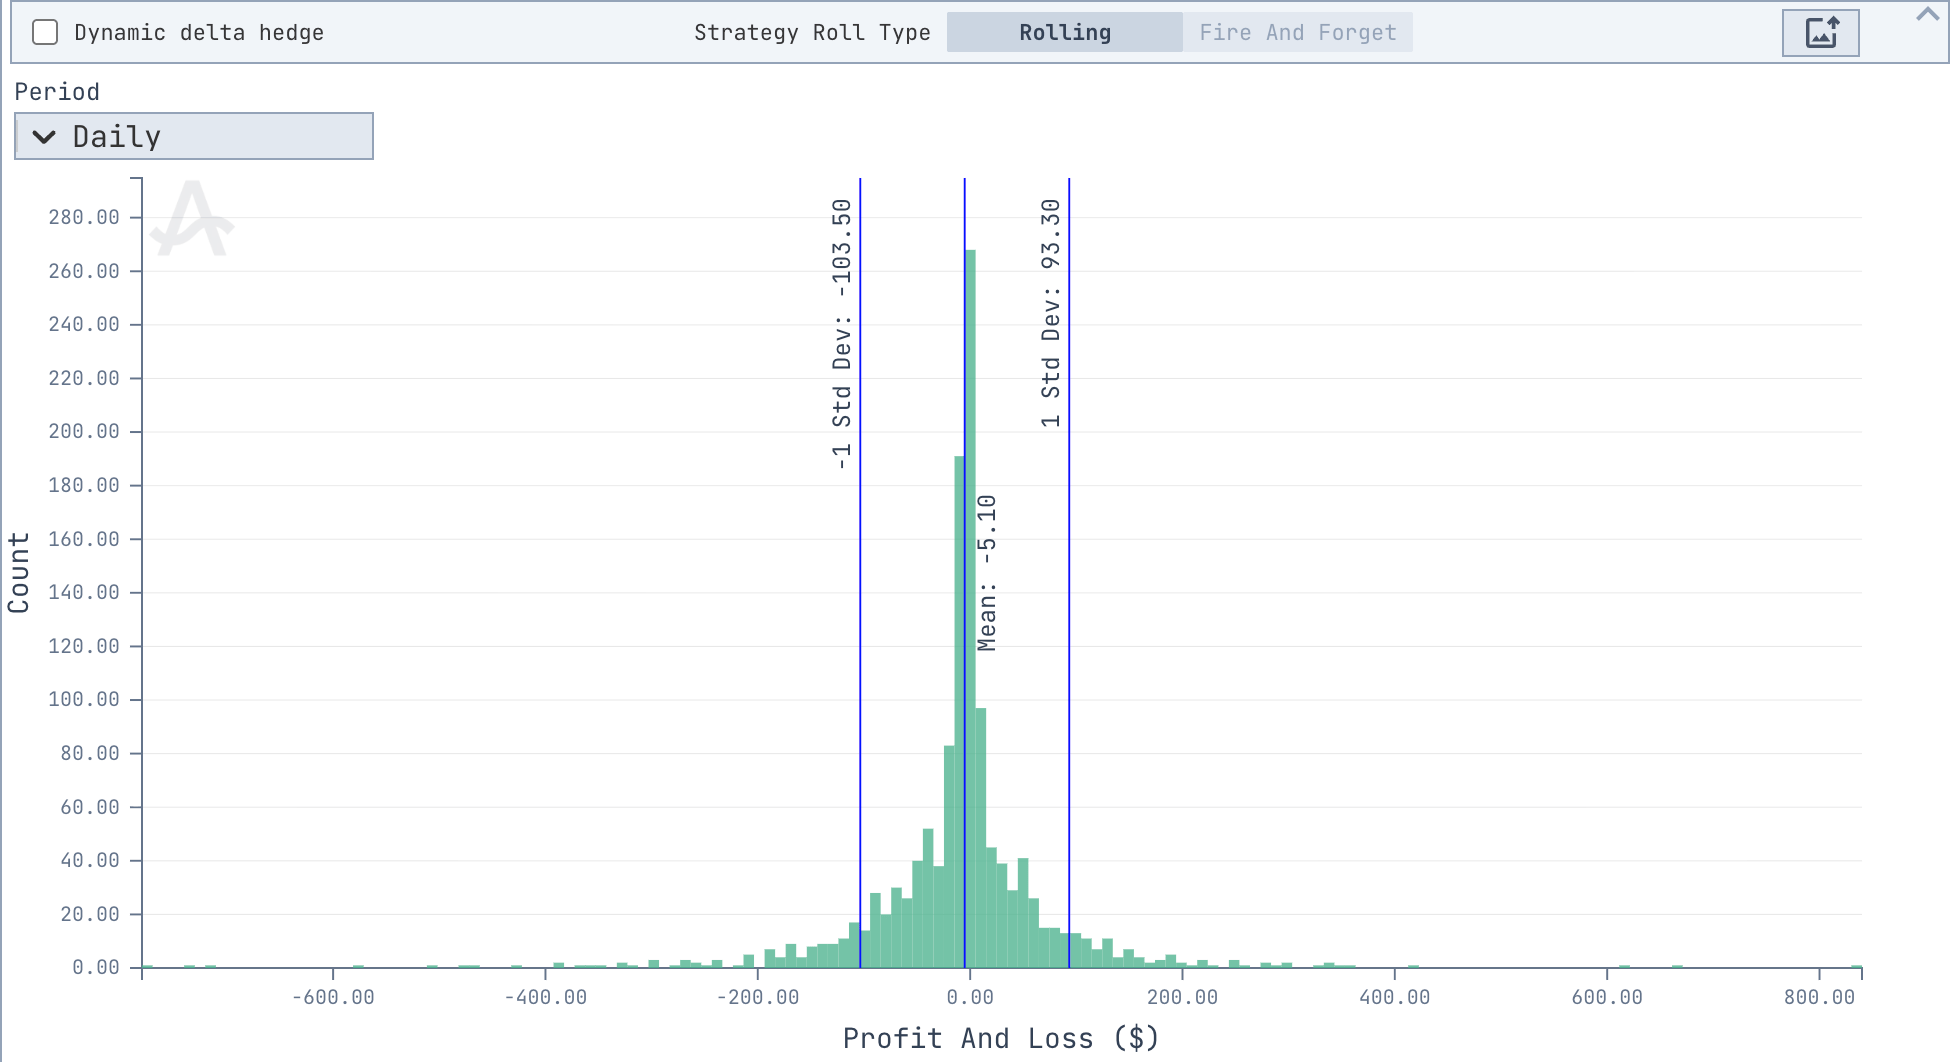
- Risk Analysis: Identify typical gain/loss ranges and tail risk exposure.
- Return Consistency: Determine whether results are tightly clustered or widely spread.
- Performance Comparison: Contrast distributions for different strategies or roll methods.
- Drift and Hedge Testing: Evaluate how dynamic delta hedging or drift adjustments impact daily P&L variance.
Interactive Controls

Chart Components
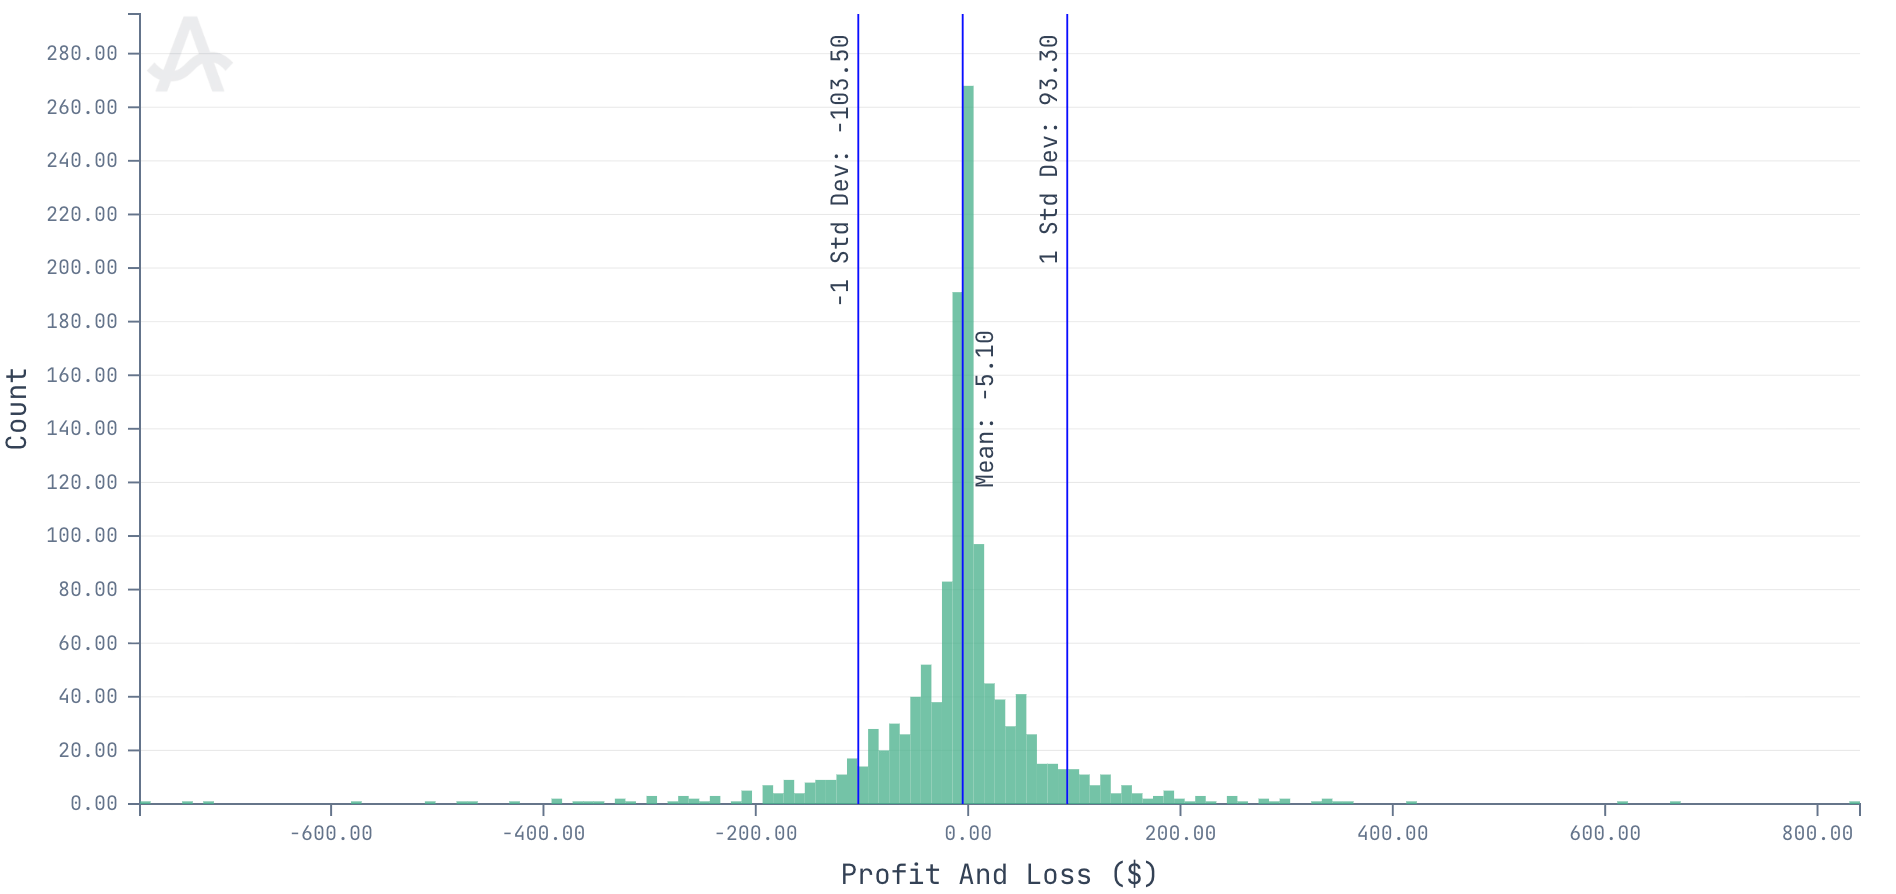
- X-Axis: Profit and Loss ($) — shows the range of observed daily or period returns.
- Y-Axis: Count — frequency of occurrences for each P&L bucket.
- Bars: Represent the number of samples that fall into each P&L range; higher bars = more frequent results.
- Mean (μ): Centerline indicating average performance.
- ±1 Std Dev (σ): Blue vertical lines marking one standard deviation from the mean — illustrating volatility of returns.
- Tooltip Data: Displays the precise range and observation count when hovering on any bar.
Data & Methodology
- Source: Derived from the backtest engine using the currently selected strategy definition and pricing configuration.
- Computation:
- Reconstructs daily (or chosen period) P&L values for all backtested intervals.
- Aggregates results into histogram bins.
- Computes descriptive statistics — mean, median, and standard deviation.
- Dynamic Delta Hedge: When enabled, adjusts daily P&L for re-hedging actions based on underlying movement.
- Roll Logic: The “Rolling” mode keeps the position active through contract expiries; “Fire and Forget” terminates each trade independently.
The distribution provides an empirical view of realized backtest outcomes — no assumptions of normality are applied.
Allasso Trade’s charts and interpretation tips describe market data and past behaviour. They are not a
forecast, and nothing in them is investment advice.