

Description
🎛️ Interactive Controls

📊 Chart Components Trade P&L Paths (Main Panel)
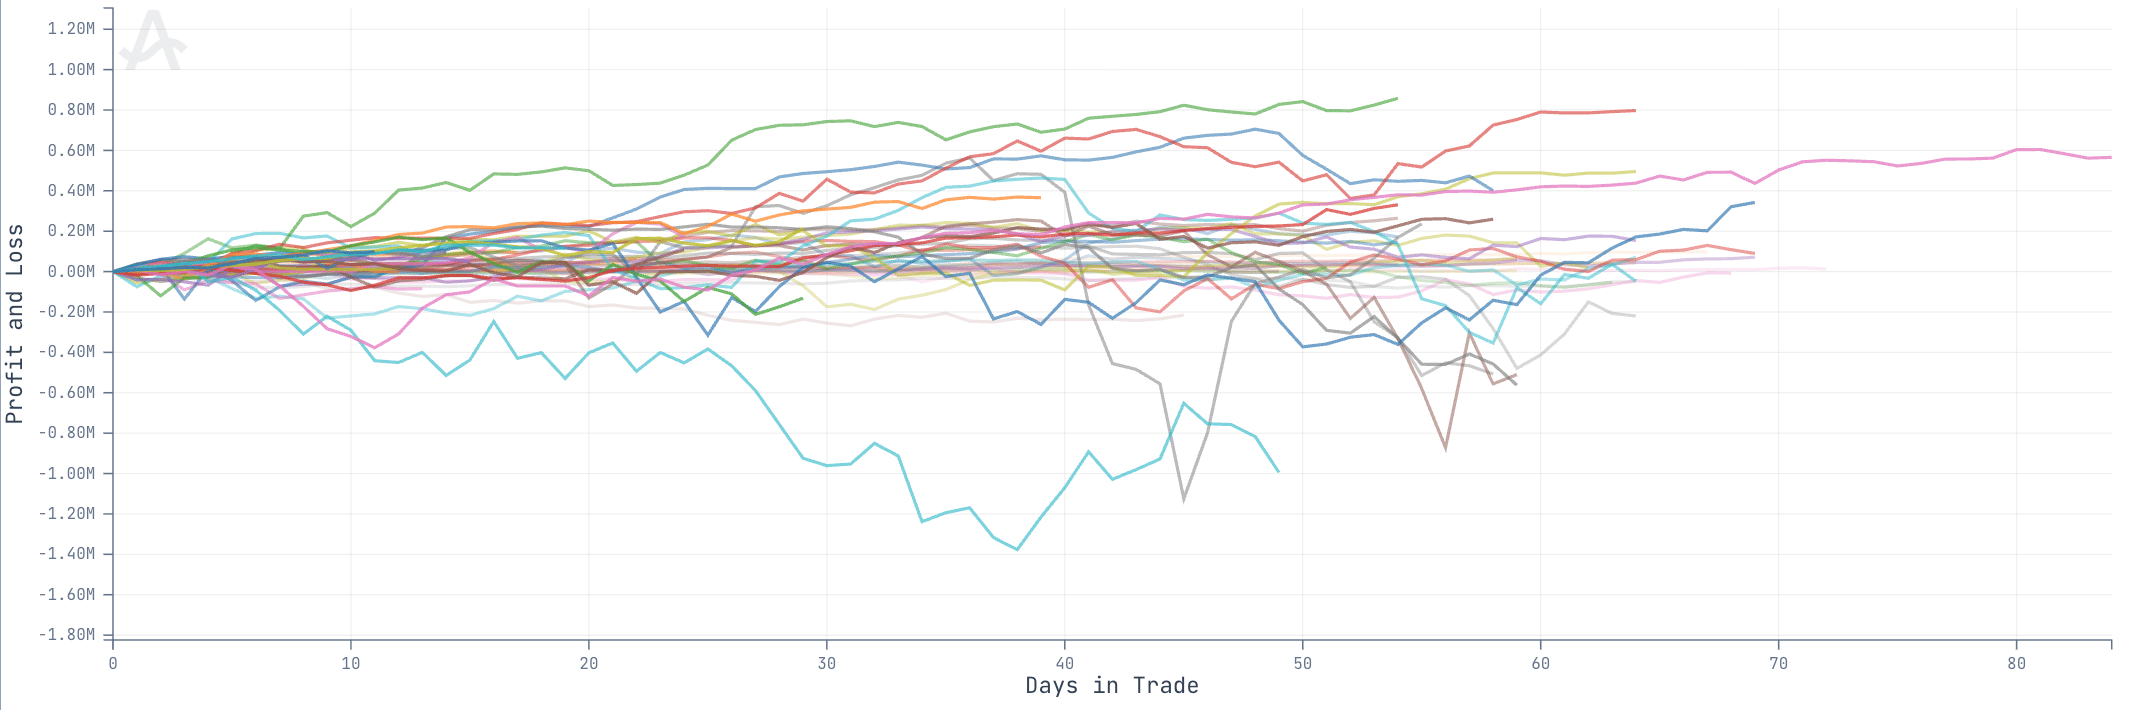
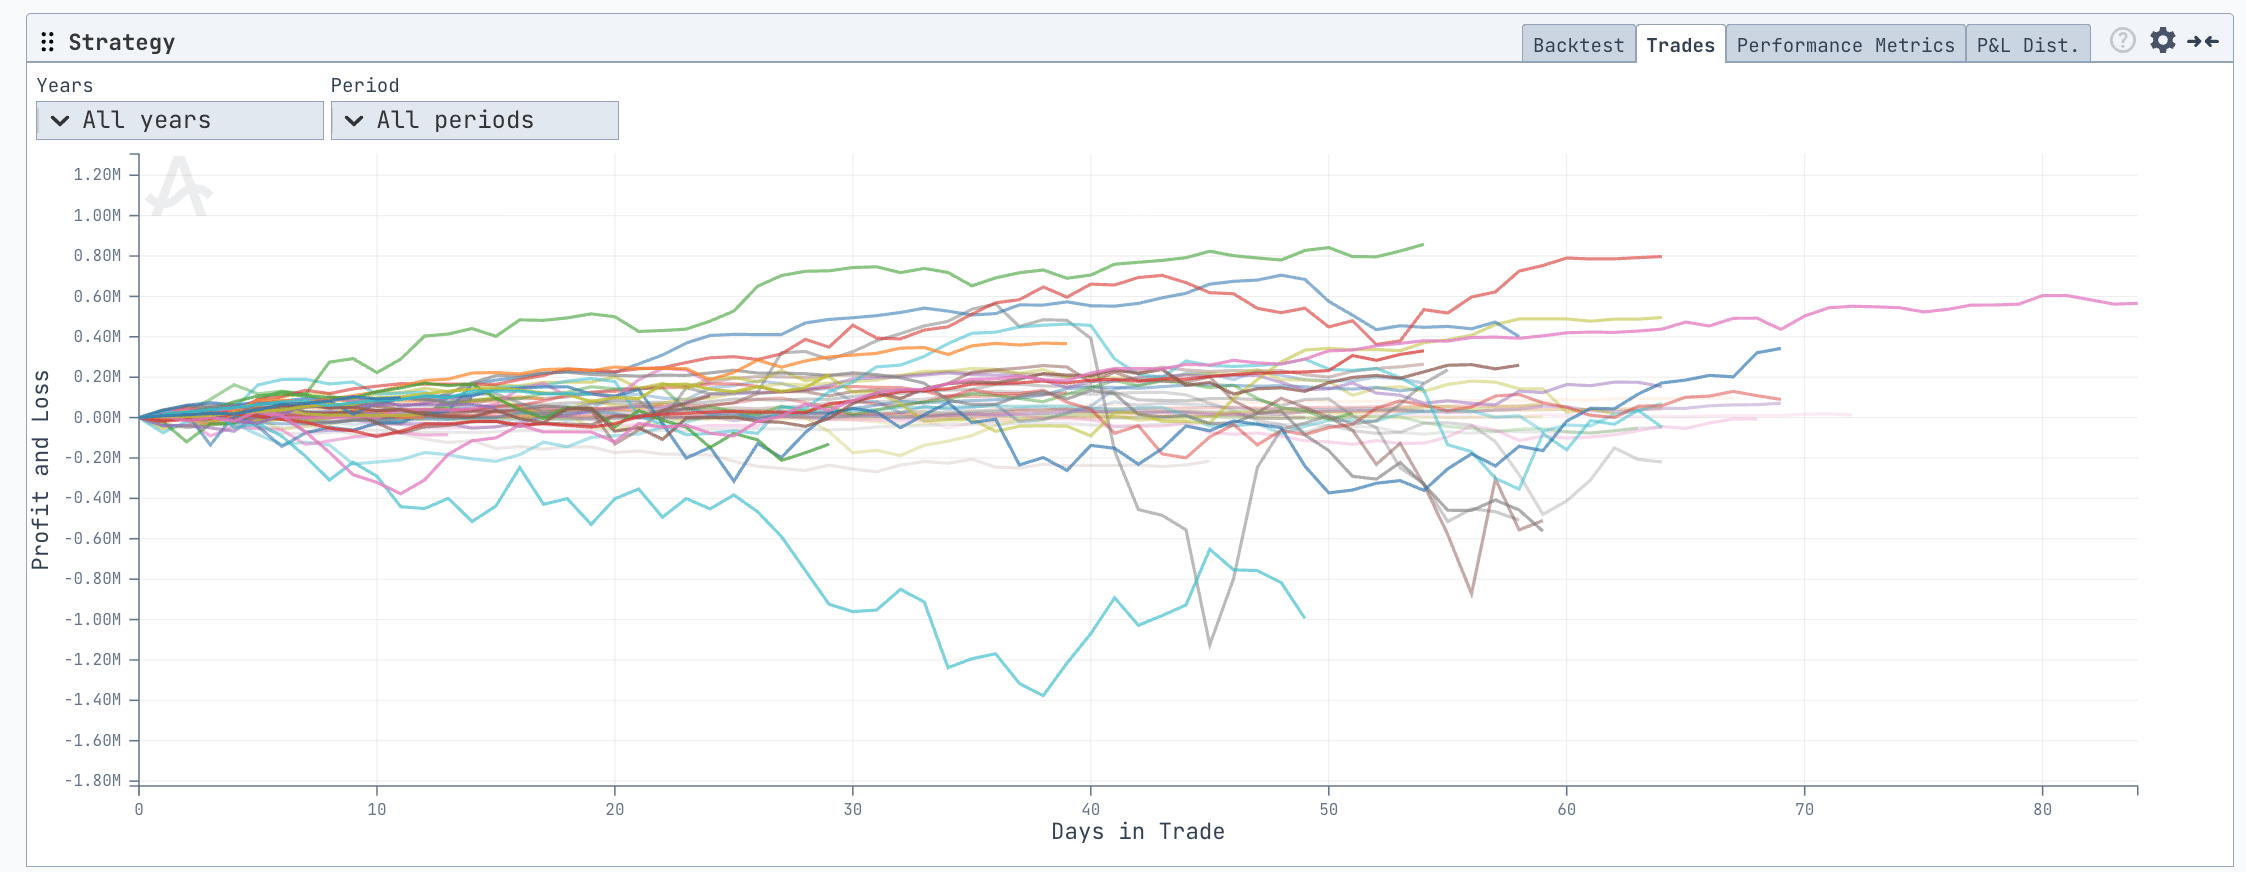
- Each colored line represents a single trade instance from historical backtests.
- Vertical Axis: Profit and Loss ($).
- Horizontal Axis: Days in Trade — progression of each trade over its holding period.
- Zero Line: Represents breakeven; trades above are profitable, below are losses.
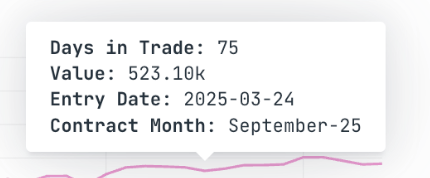
- Hover Panel: Shows detailed metrics for the selected trade (days held, P&L, entry date, contract month).
📚 Data & Methodology
- Instant Backtesting Engine: Recreates each trade historically using the same structure, underlying, and model parameters currently selected.
- Entry Logic: Uses the defined entry criteria (e.g., relative to contract roll date or price condition) at each historical instance.
- Mark-to-Market: P&L is computed daily using historical market data and current option valuation models.
- Exit Criteria: Each trade is held until the defined holding period (or until expiry if applicable).
Allasso Trade’s charts and interpretation tips describe market data and past behaviour. They are not a
forecast, and nothing in them is investment advice.