

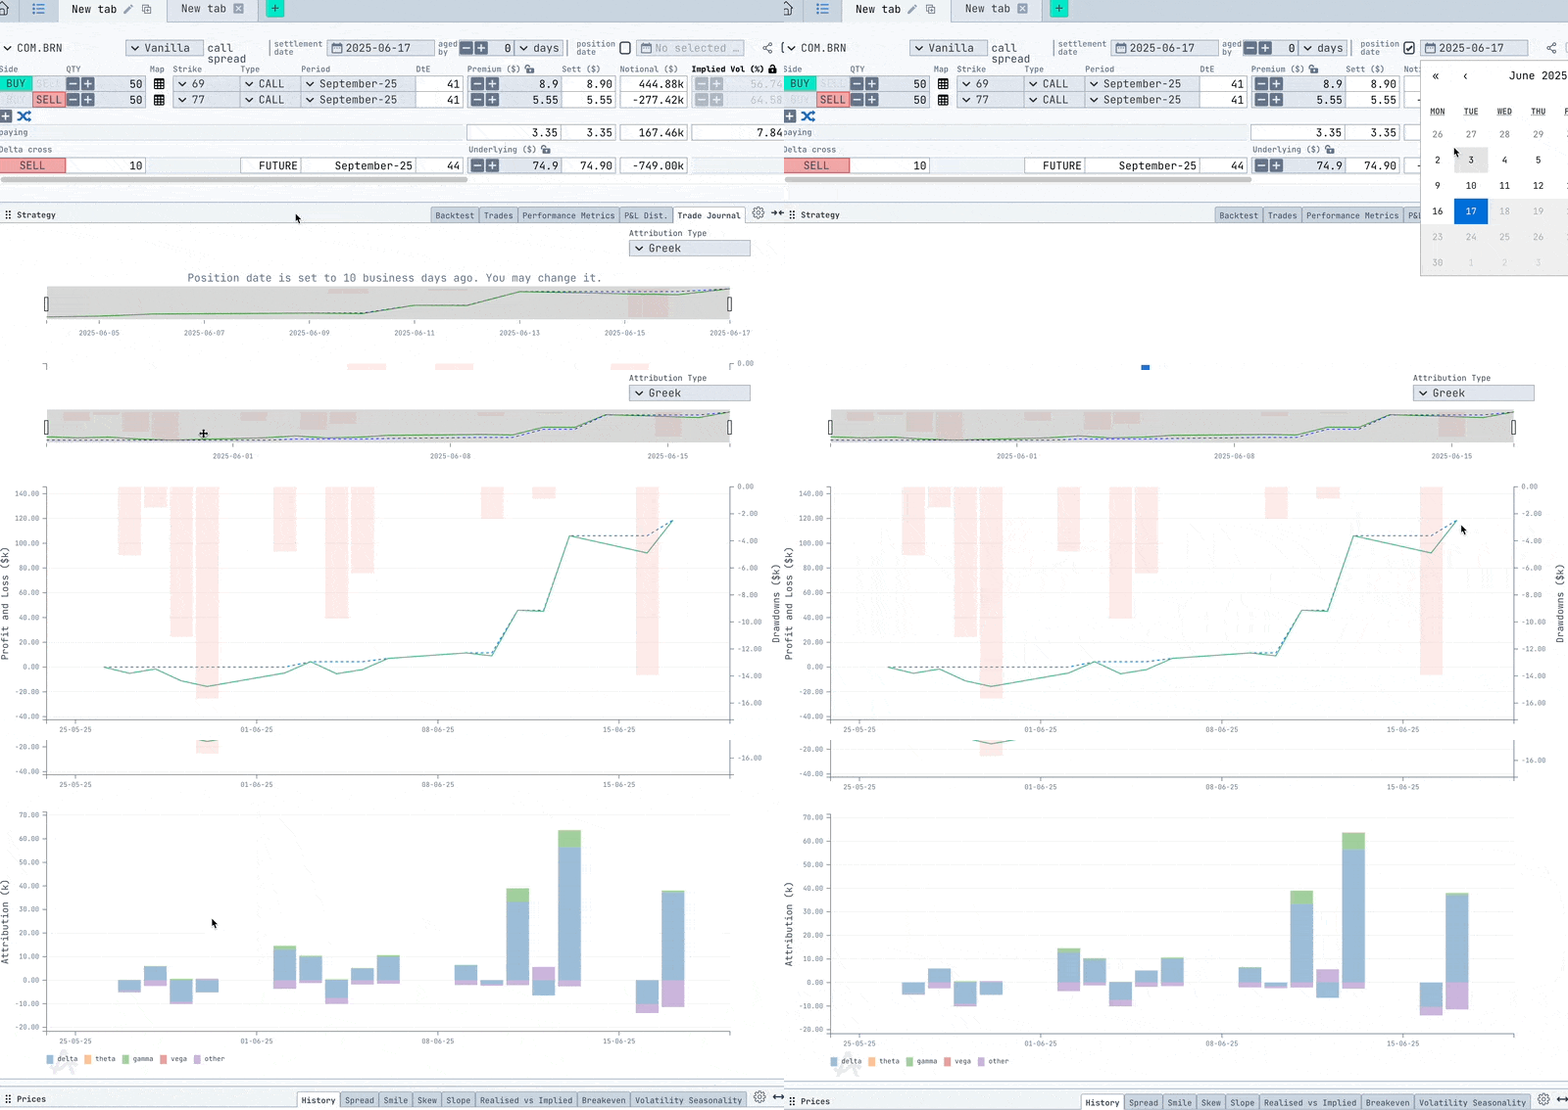
Description
The Trade Journal enables post-trade analytics and performance auditing for individual trades. Once a strategy is flagged as “traded”, this module becomes the home for monitoring:- Profitability evolution
- Drawdown events
- Risk driver attribution by Greeks
Key Use Cases:
- Post-mortem analysis: Understand what worked, what didn’t.
- Attribution audit: See which Greeks (Delta, Theta, Vega, etc.) drove outcomes.
- Drawdown tracking: Observe timing and depth of adverse moves.
- Behavioural reinforcement: Build confidence in process or uncover bias patterns.
Interactive Controls

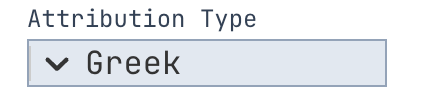
- Attribution Type Selector: Available attribution categories
- Greek - Attribution calculated by delta
- Legs - Attribution calculated by leg
Chart Components

- Zoom Control - Drag to isolate specific time windows
- Mini Map - Full range of P&L and Drawdown for entire life of the trade
P&L and Drawdowns Over Time (Top Chart)
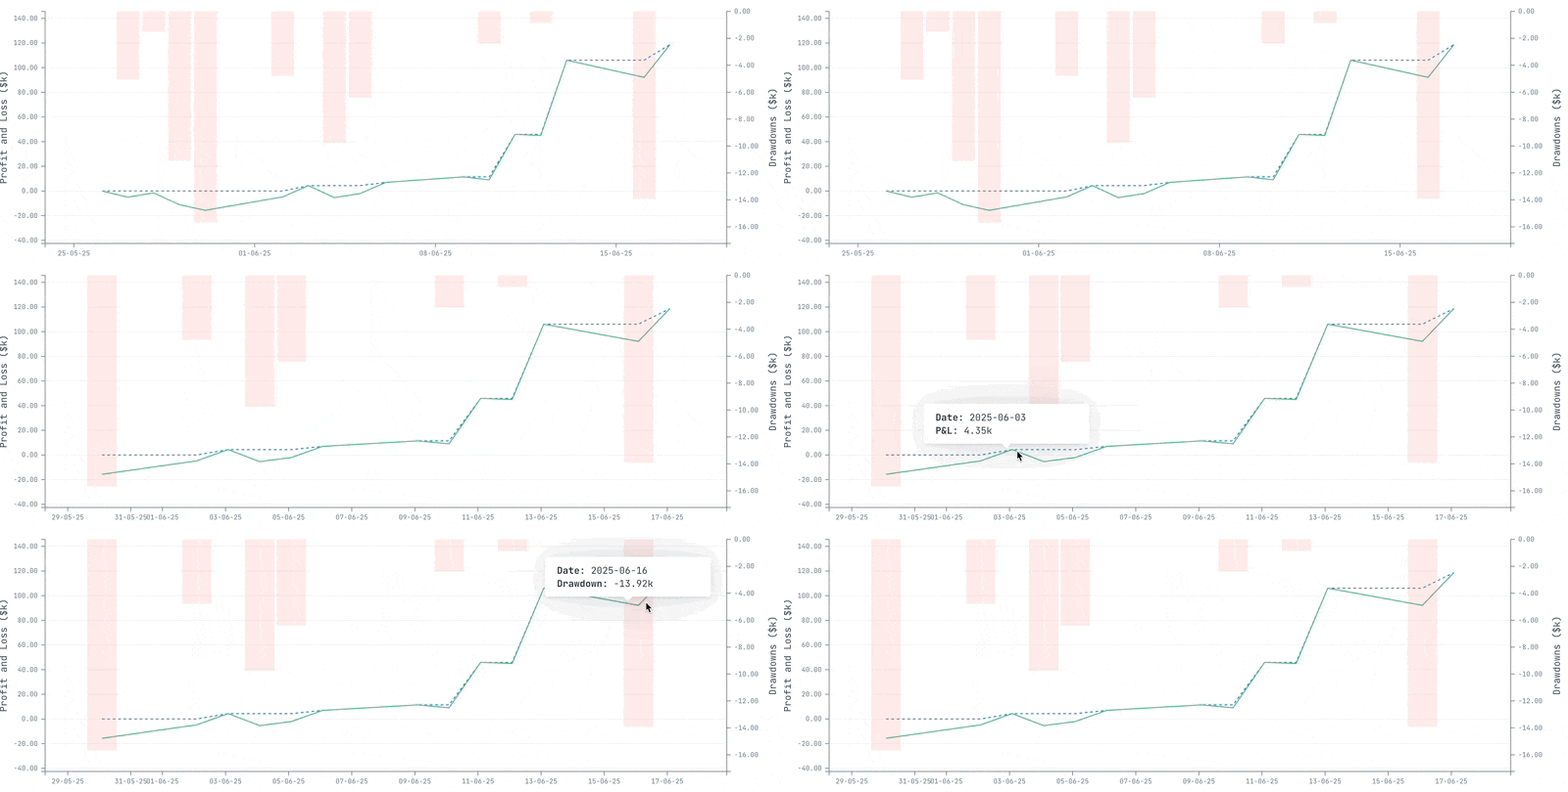
- Green Line: Realised Profit & Loss ($k) of the selected trade.
- Dashed Blue Line: High watermark of the selected trade’s P&L
- Red Bars (Background): Drawdown zones from most recent equity peaks.
- Y-axis Left: Trade Profit & Loss.
- Y-axis Right: Trade Drawdown in $k.
Attribution Breakdown (Bottom Chart)
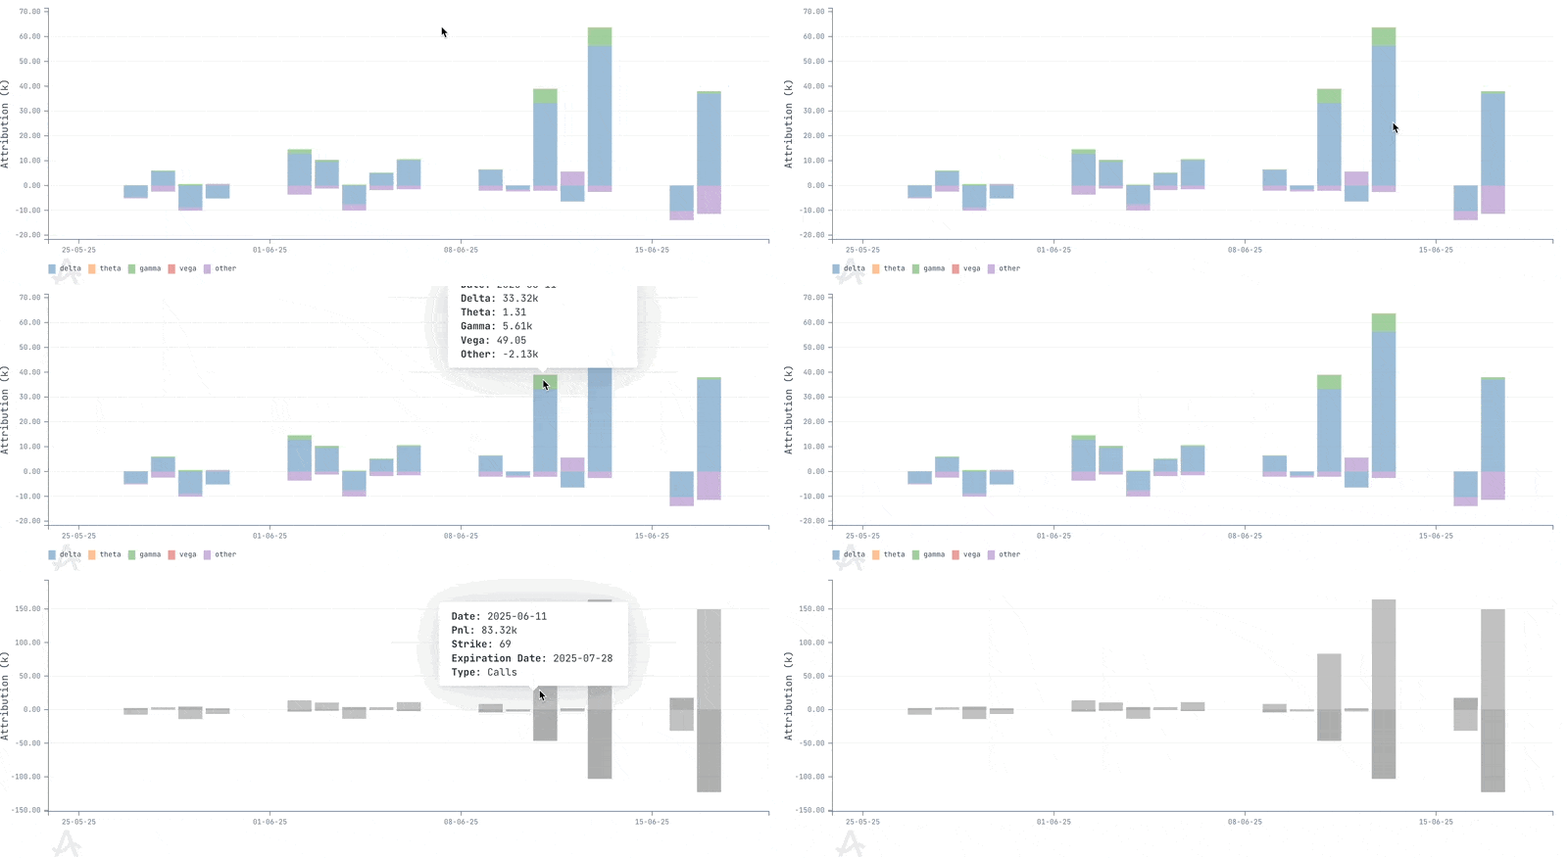
- Coloured Bars - P&L Contribution in $k to the P&L depending on attribution type
- Greek - Attribution per Greek (delta, gamma, theta, vega)
- Leg - Attribution per all used legs.
Data Sources
- Marked Trade Date: Manually entered by the user.
- P&L Tracking: Calculated from the daily settlement of traded instruments.
- Greek Sensitivities: Aggregated and estimated from option models applied to trade legs.
- Drawdowns: Computed continuously from realised P&L progression.
Interpretation Tips
- Isolate drivers: Look for days when a specific Greek dominates the attribution — this can signal structural exposure or unexpected behavior.
- Positive streaks vs drawdowns: Match large drawdowns with attribution to see if Vega spikes or Delta trends were the cause.
- Trade efficiency: Compare time decay (Theta) vs Gamma to assess how well a trade aged.
- Execution review: Was P&L skewed early or late in the trade’s life? This can help refine entry/exit timing rules.
- Learning archive: Use a library of past trades to build playbooks, documenting what setups produce consistent outcomes.
Allasso Trade’s charts and interpretation tips describe market data and past behaviour. They are not a
forecast, and nothing in them is investment advice.