

Description
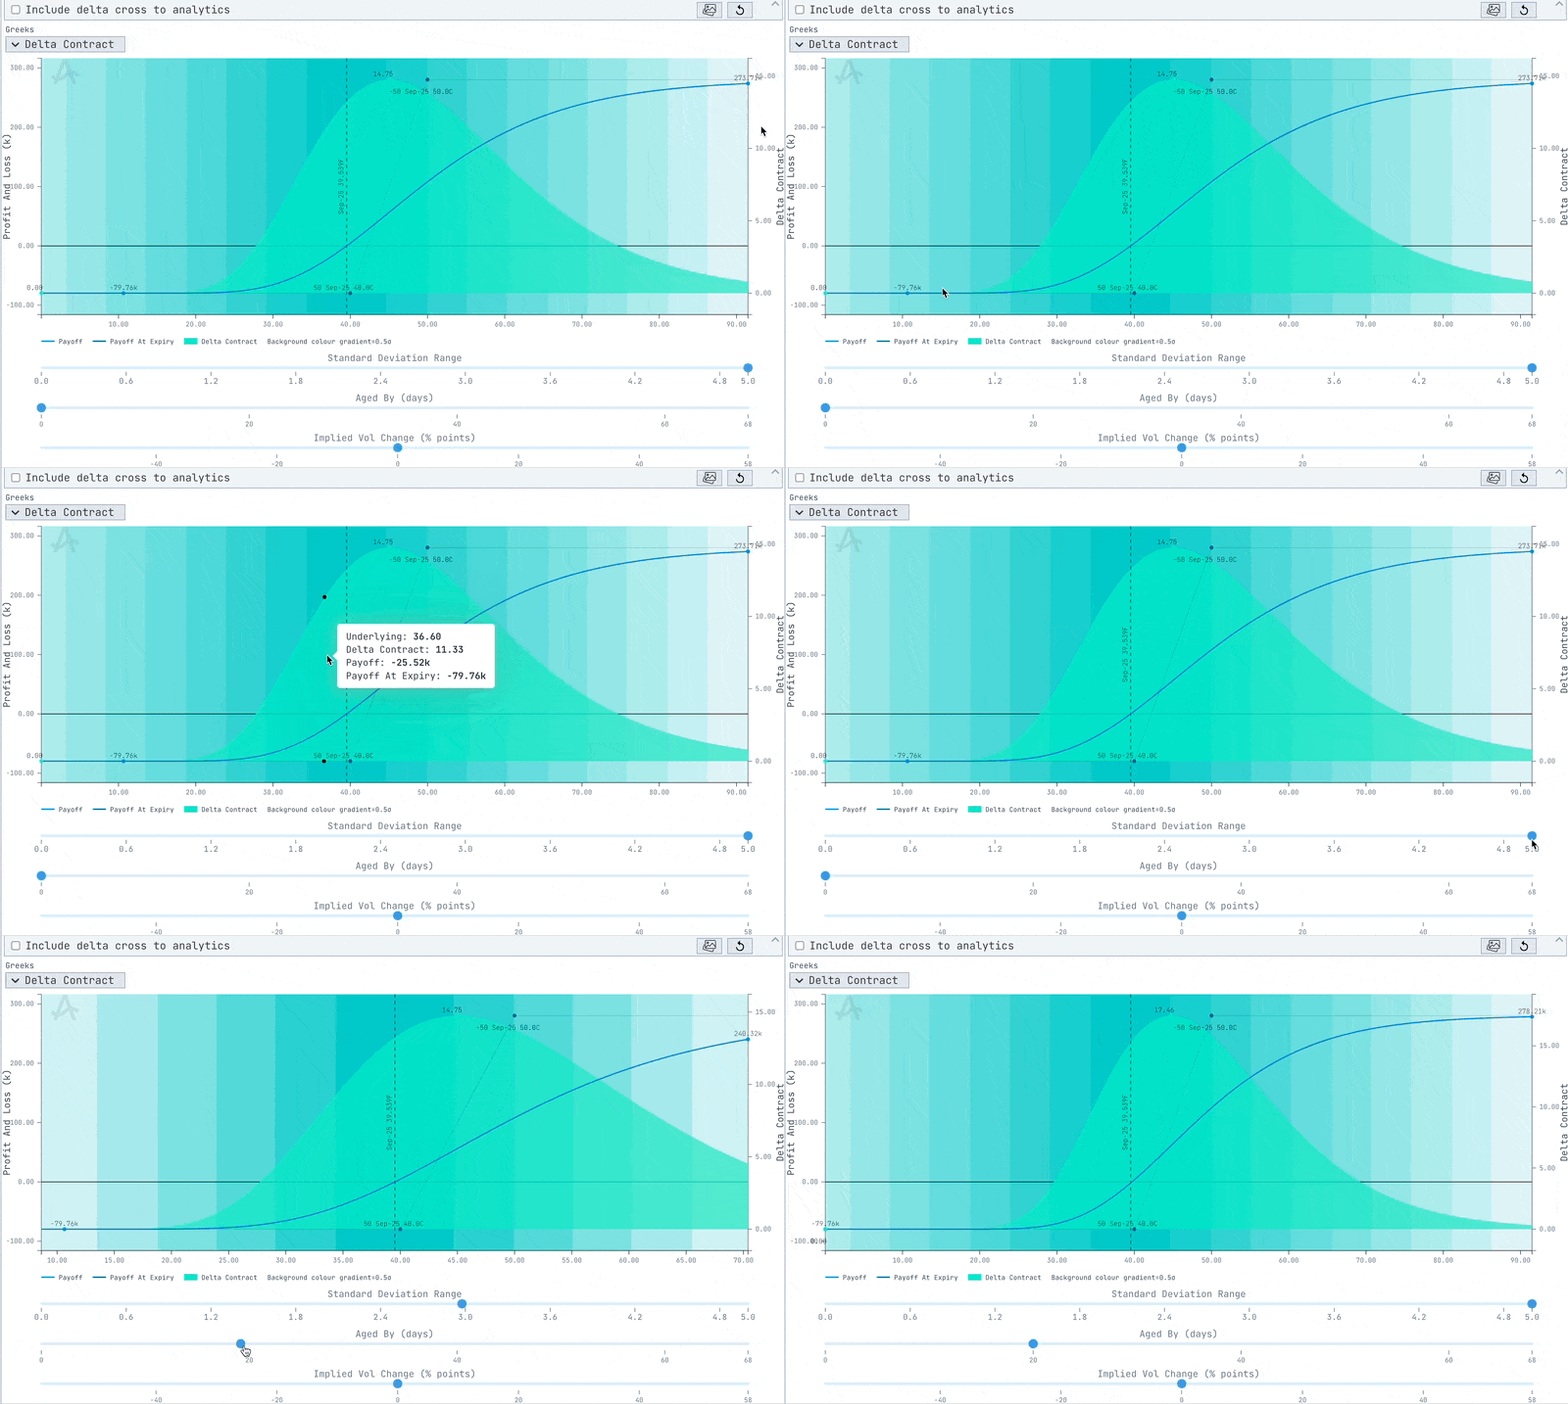
The Option Payoff Chart visualizes the P&L of an options strategy across different underlying prices, while dynamically incorporating sensitivities such as Greeks, time decay, and volatility shifts. It provides an intuitive view of the trade’s payoff landscape — both at expiry and at the current time — to support deeper understanding and better decision-making. This chart helps evaluate how an options structure performs under different market conditions by plotting:- Real-time payoff
- Payoff at expiry
- Greek exposure (e.g., Delta, Vega)
- Dynamic changes in underlying, volatility, and time
Interactive Controls

- Standard Deviation Range Slider - Adjust the price range (X-axis) in σ units to center the view around spot.
- Aged By (days) - Shift the evaluation point forward in time to assess theta impact.
- Implied Vol Change (%) - Flex implied volatility up/down to see effect on P&L and Greeks.
Chart Components
Main Plot
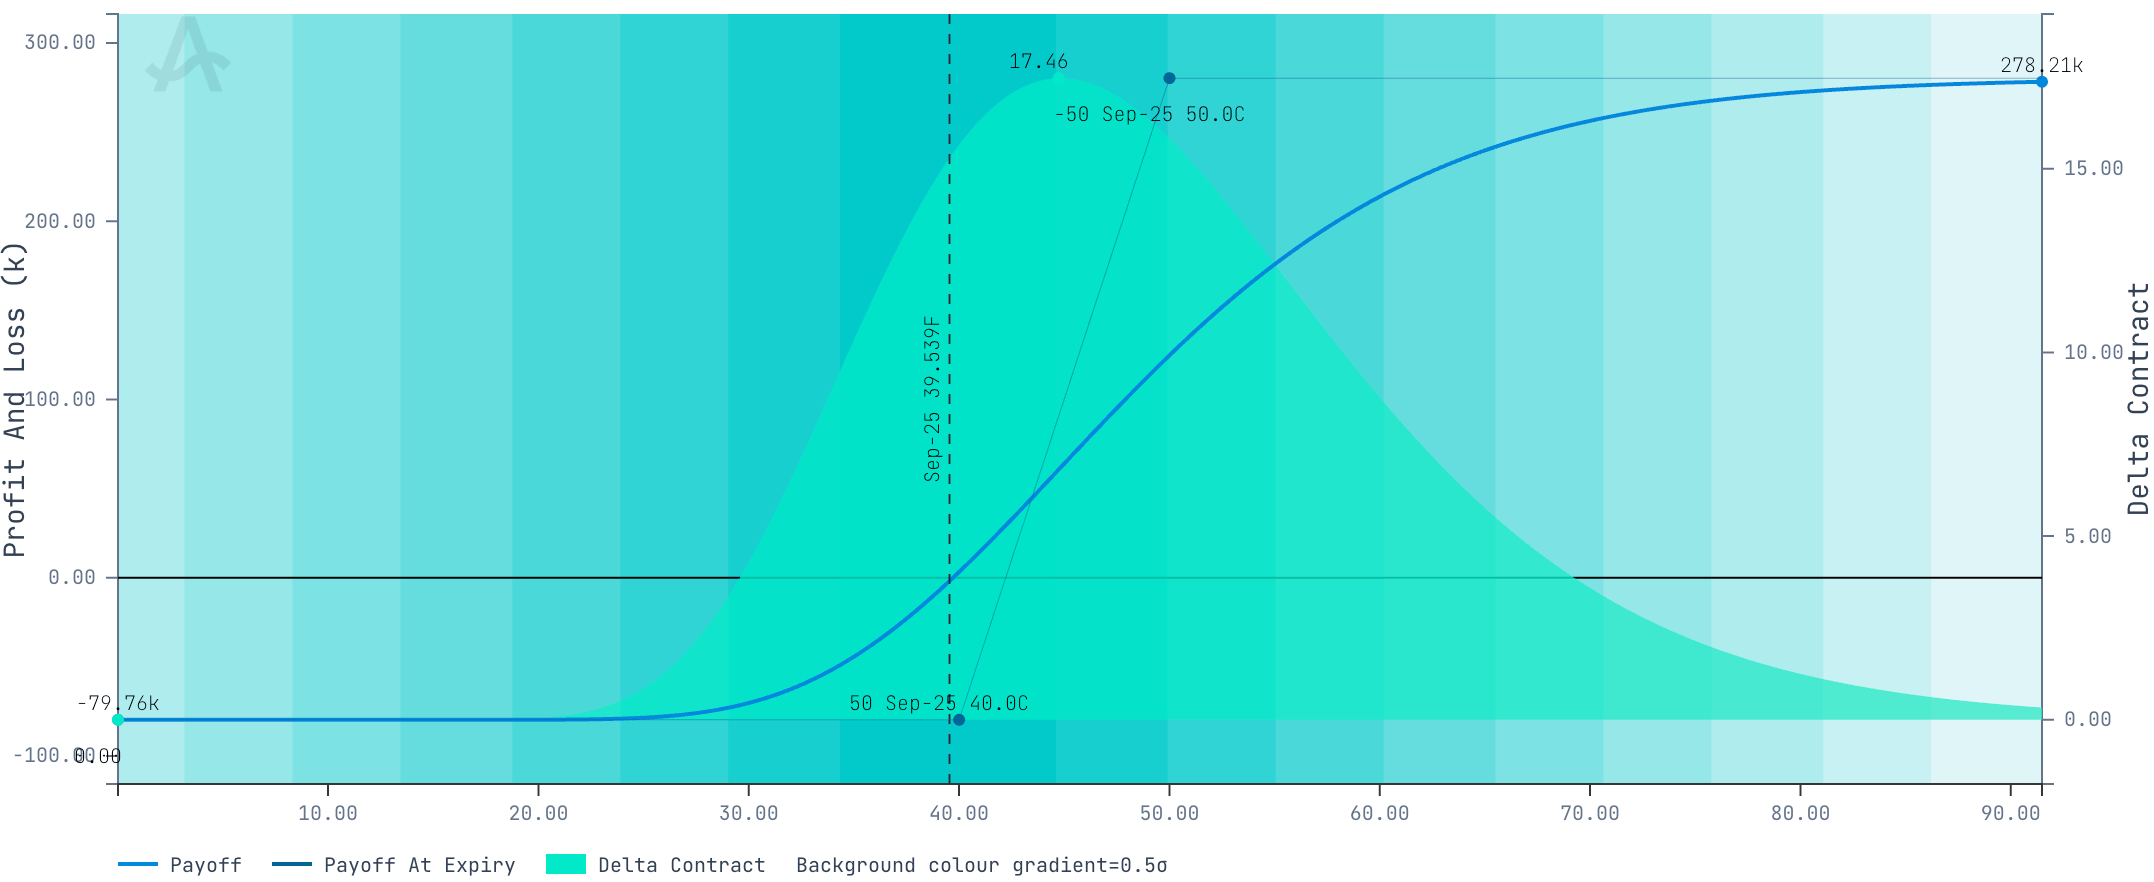
- Blue Line (Payoff) - P&L profile as of today, reflecting real-time market Greeks and pricing.
- Black Line (Payoff at Expiry) - Final payoff if held to expiry, assuming no change in IV.
- Green/Gradient Area - Selected Greek (e.g., Delta Contract) across price levels.
- Dots & Labels - Display positions, e.g., +50 Sep-25 40.0C, with value annotations.
X-Axis
- Represents underlying asset price range (centered around current spot).
- Tick marks scaled in standard deviations (σ) from the current price.
Y-Axis
- Left Side: Profit and Loss (in $k)
- Right Side: Selected Greek value (Delta, Vega, etc.)
Data Sources
- Option Valuation: Derived from settlement pricing and volatility curves.
- Greek Calculations: Performed on-the-fly using trade structure and selected shifts.
- Payoff at Expiry: Based purely on intrinsic value at each price node.
Interpretation Tips
- Payoff vs Expiry Line: Use the gap to see how time value or volatility premiums affect returns.
- Delta Curve: Shows how directional exposure evolves — steep changes indicate Gamma-heavy zones.
- Volatility Shift Sensitivity: Use the slider to model vega risk; higher vol helps long options, hurts shorts.
- Time Aging: Advancing time helps see whether theta will benefit or erode the position.
Allasso Trade’s charts and interpretation tips describe market data and past behaviour. They are not a
forecast, and nothing in them is investment advice.