

Description
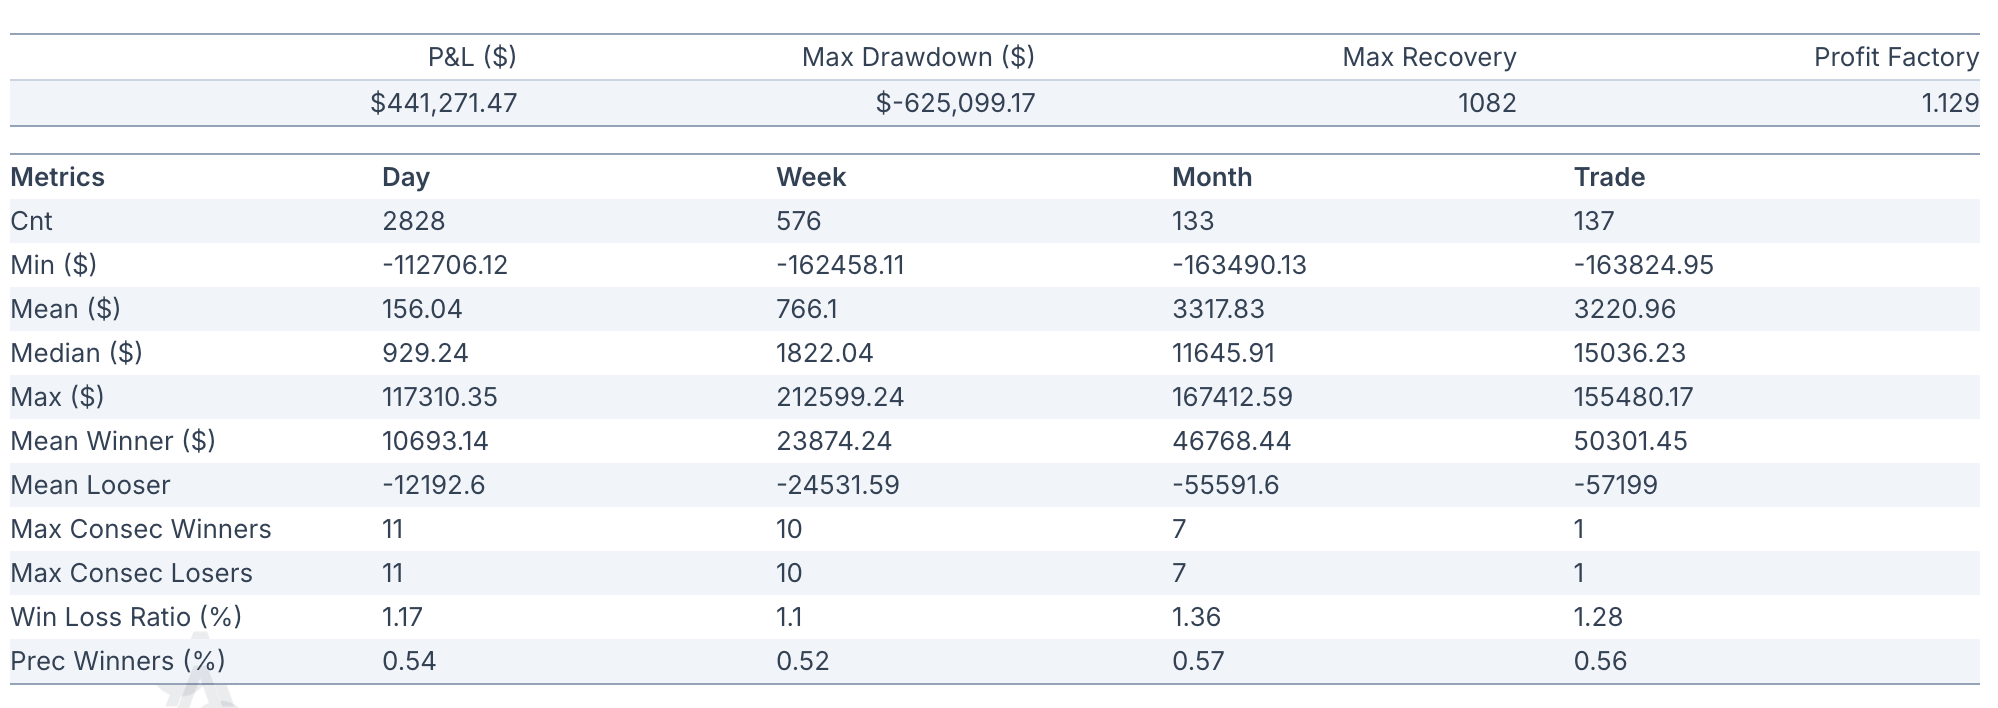
This table condenses key performance indicators from the strategy backtest into a single, easy-to-interpret view. It breaks down profitability, risk, and trade characteristics across multiple timeframes — Day, Week, Month, and Trade — to support comprehensive performance evaluation. The Performance Metrics Table provides a detailed statistical breakdown of a backtested strategy’s results. It captures:- Profitability metrics (P&L, win/loss)
- Risk measures (drawdowns, recovery time)
- Trade distribution and consistency
- Win/loss patterns and ratios
Table Components
Global Metrics (Top):

- P&L ($): Total cumulative profit and loss.
- Max Drawdown ($): Worst historical peak-to-trough loss.
- Max Recovery: Longest recovery stretch in time periods.
- Profit Factor: Ratio of total gross profits to total gross losses.
Timeframe-Specific Statistics (Bottom):
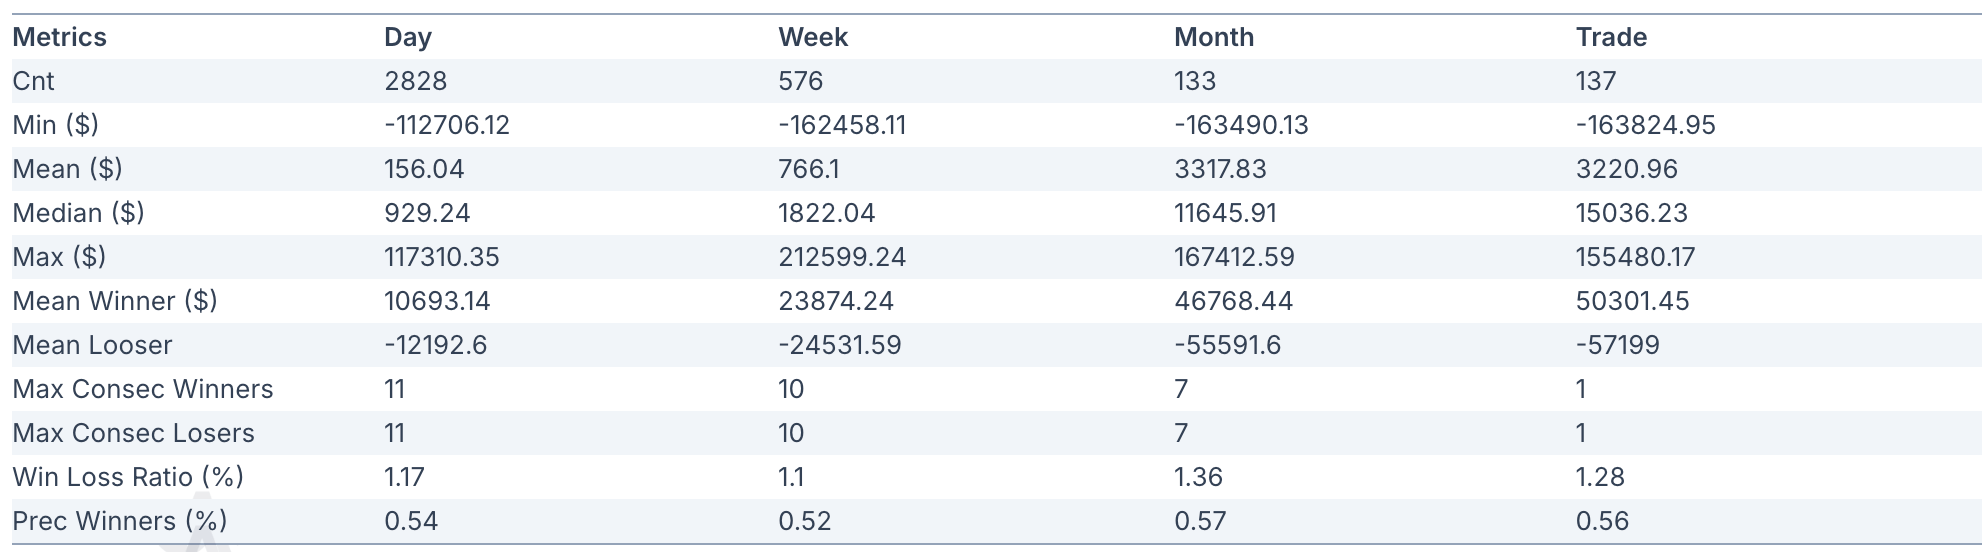
- Cnt - Number of periods or trades
- Min / Max ($) - Lowest and highest single-period returns.
- Mean / Median ($) - Average and middle-value returns.
- Mean Winner/Loser - Average win and loss per winning/losing period.
- Max Consec Winners - Longest winning streak.
- Max Consec Losers - Longest losing streak.
- Win/Loss Ratio (%) - Ratio of average win to average loss.
- Prec Winners (%) - Proportion of periods that were profitable (e.g., 0.54 = 54% win rate).
Data Sources
- Strategy Trades: Simulated based on historical execution of the defined structure.
- Profit/Loss Calculations: Computed per interval from marked-to-market P&L series.
- Drawdowns & Recovery: Derived from rolling equity curve peak and recovery tracking.
Interpretation Tips
- Mean vs Median: Large divergence suggests outliers — check distribution skew.
- Win/Loss Ratio > 1: On average, winners make more than losers lose — a healthy sign.
- Max Drawdown vs Profit Factor: High drawdowns may still be tolerable if profit factor is strong.
- Consistency Signals:
- High % winners + stable mean returns = reliable strategy.
- Low drawdowns with short recovery = resilient under stress.
Allasso Trade’s charts and interpretation tips describe market data and past behaviour. They are not a
forecast, and nothing in them is investment advice.