

Description
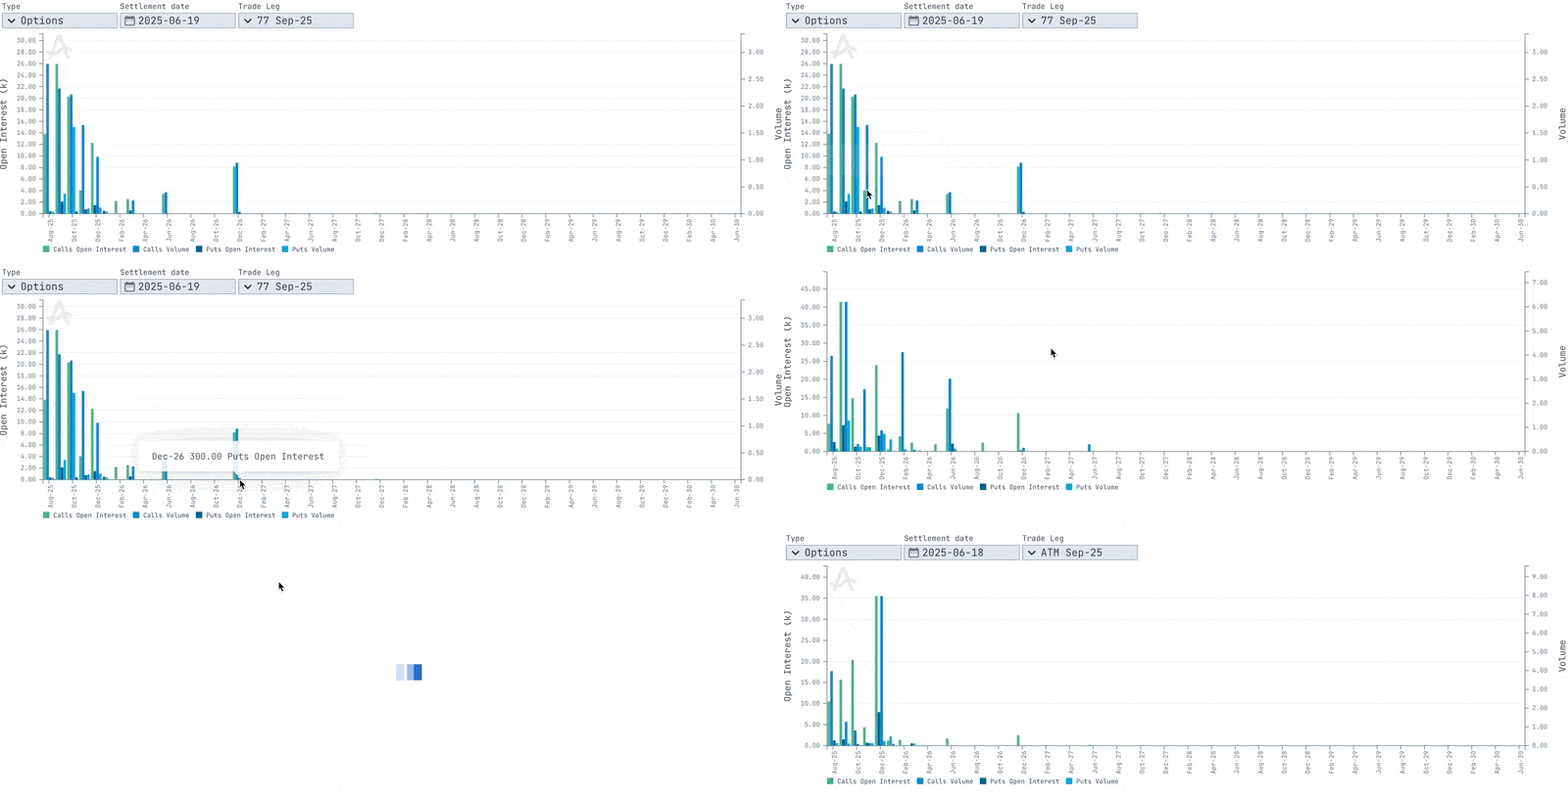
The Curve OI & Volume Chart displays open interest and volume for both calls and puts across the full option expiry curve. It provides a cross-sectional view of where activity is concentrated in terms of maturities, making it an essential tool for understanding market depth and forward interest. It is particularly helpful for:- Evaluating trade viability across expiries
- Detecting where market participants are building long-term or short-term positions
- Selecting optimal expiries based on depth and execution comfort
Key Use Cases:
- Roll planning: See where liquidity builds in the forward curve
- Strategy structuring: Match trade duration with volume hubs
- Risk budgeting: Understand when interest thins out, increasing slippage risk
Interactive Controls

- Type - Switches between Options and Futures data
- Settlement Date - Shows the snapshot for a selected analysis date.
- Trade Leg - Chooses the specific option series
- 50 Sep-25 / 40 Sep-25 - All single legs of selected structure.
Chart Components
Bar Plot by Expiry
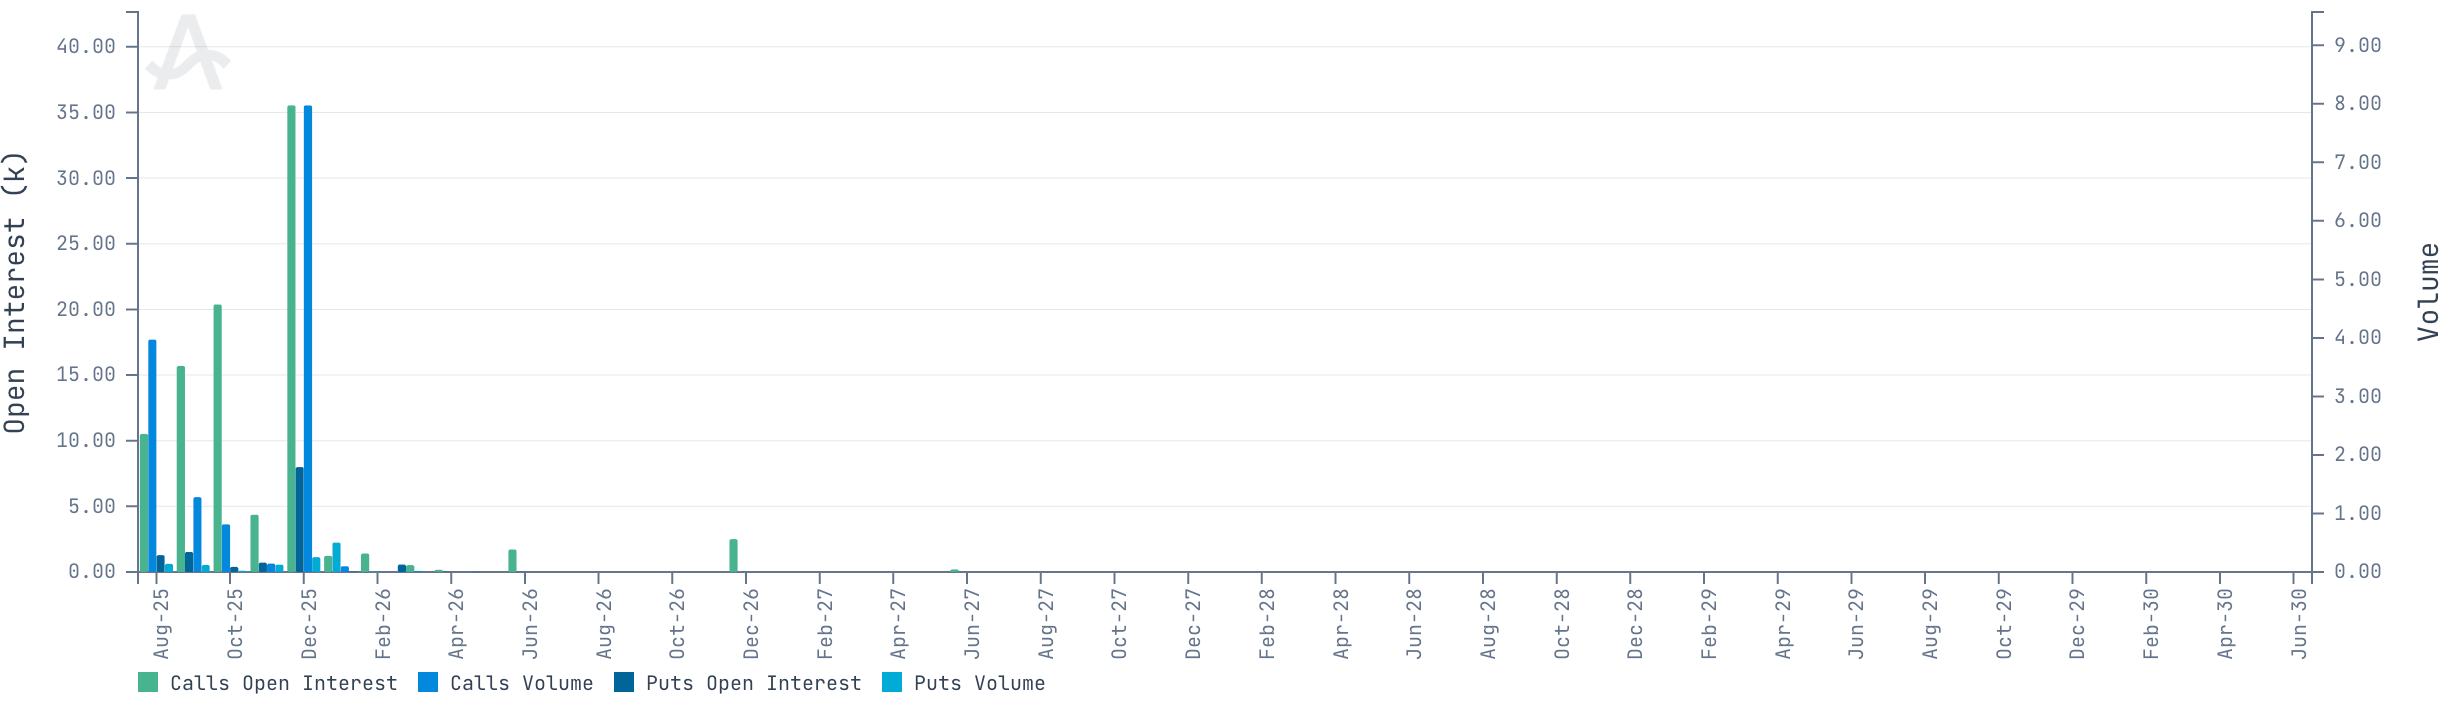
- Green Bars - Calls Open Interest.
- Dark Blue Bars - Calls Volume.
- Teal Bars - Puts Open Interest.
- Light Blue Bars - Puts Volume.
- X-Axis - Expiry dates (e.g., Jul-25 through Feb-30)
- Left Y-Axis (Open Interest) - Shows number of open contracts held (in thousands).
- Right Y-Axis (Volume) - Daily traded volume per expiry.
Data Sources
- Open Interest and Volume: Daily exchange-reported positions by expiry.
- Maturity Labels: Rolled from the option chain per snapshot date.
Interpretation Tips
- Stacked Near-Term OI: Suggests front-loaded positioning (speculation or hedging).
- Call/Put Disparities:
- More calls: bullish or covered strategies
- More puts: protective hedging or bearish outlook
- Thinning Tails: Low OI/volume in long-dated expiries implies lower liquidity/risk appetite.
- Consistent Bumps: May show roll programs or structured interest (e.g., quarterly contracts).
Allasso Trade’s charts and interpretation tips describe market data and past behaviour. They are not a
forecast, and nothing in them is investment advice.