

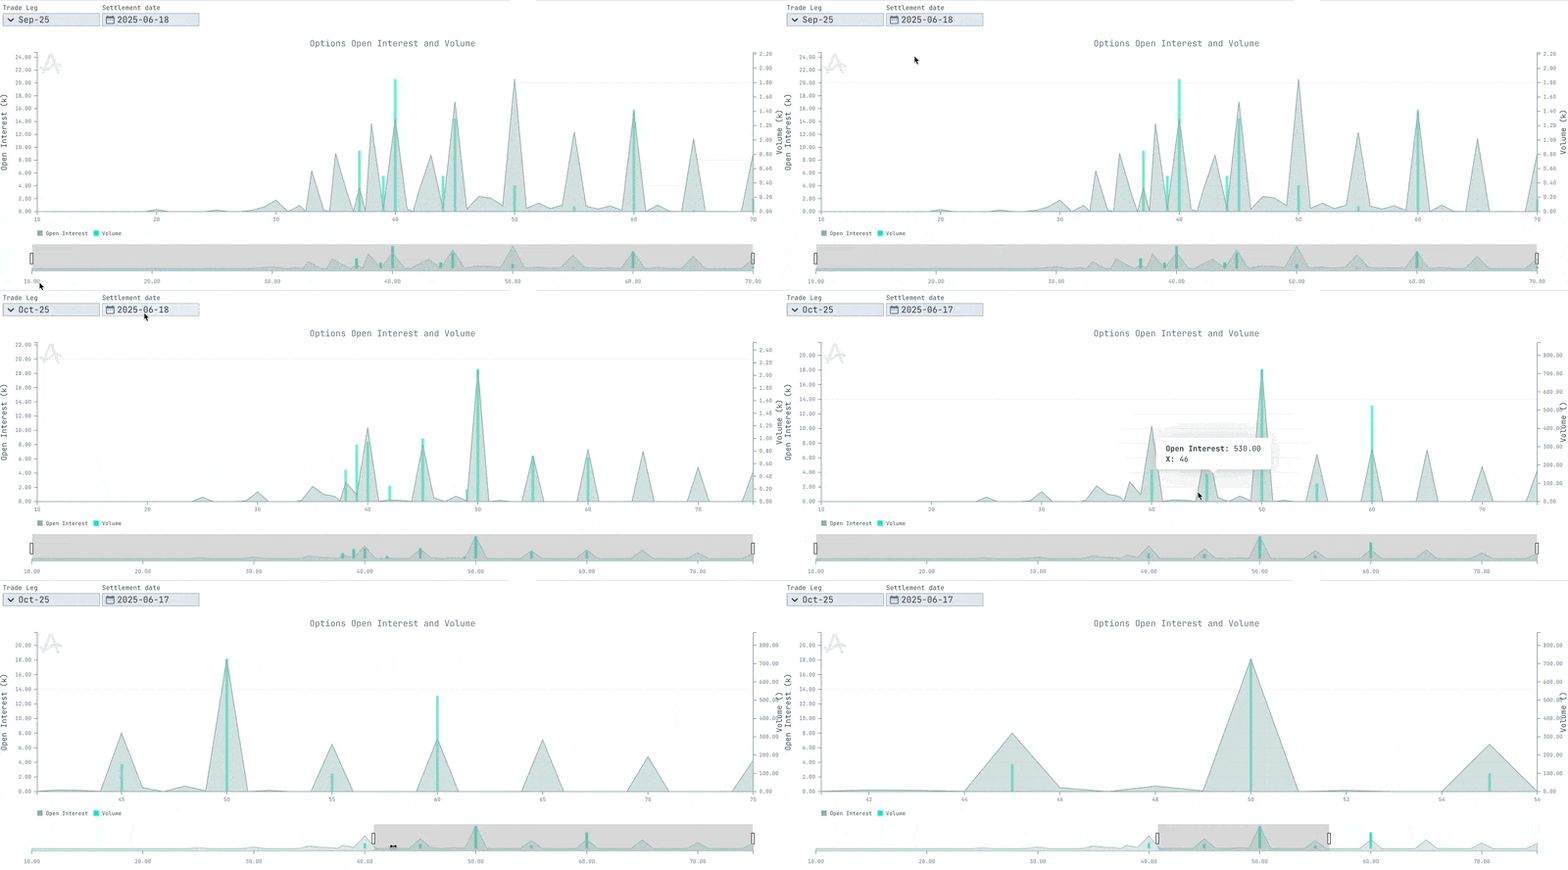
Description
The Smile OI/Volume Chart provides a snapshot of market engagement across strike prices for a specific expiry. By plotting Open Interest (OI) and Volume side-by-side for each strike, it offers powerful insights into where traders are most active, hedged, or speculating. This chart is designed to visualise current market positioning across the entire volatility smile — i.e., all available strikes for a given expiration date. It allows users to assess:- Where the liquidity is concentrated
- Which strikes are actively traded or built up
- Potential support/resistance zones based on positioning
Key Use Cases:
- Identify high-liquidity strikes for execution planning.
- Detect unusual activity (e.g., volume spikes at illiquid wings).
- Map speculative interest vs hedging behavior.
- Guide structure design around volume clusters or OI peaks.
Interactive Controls

- Trade Leg - Select the expiry or structure leg to inspect (e.g., Sep-25, Oct-25).
- Settlement Date - Defines the observation point in time for the chart.
Chart Components
Main Plot - Strike-by-Strike OI/Volume
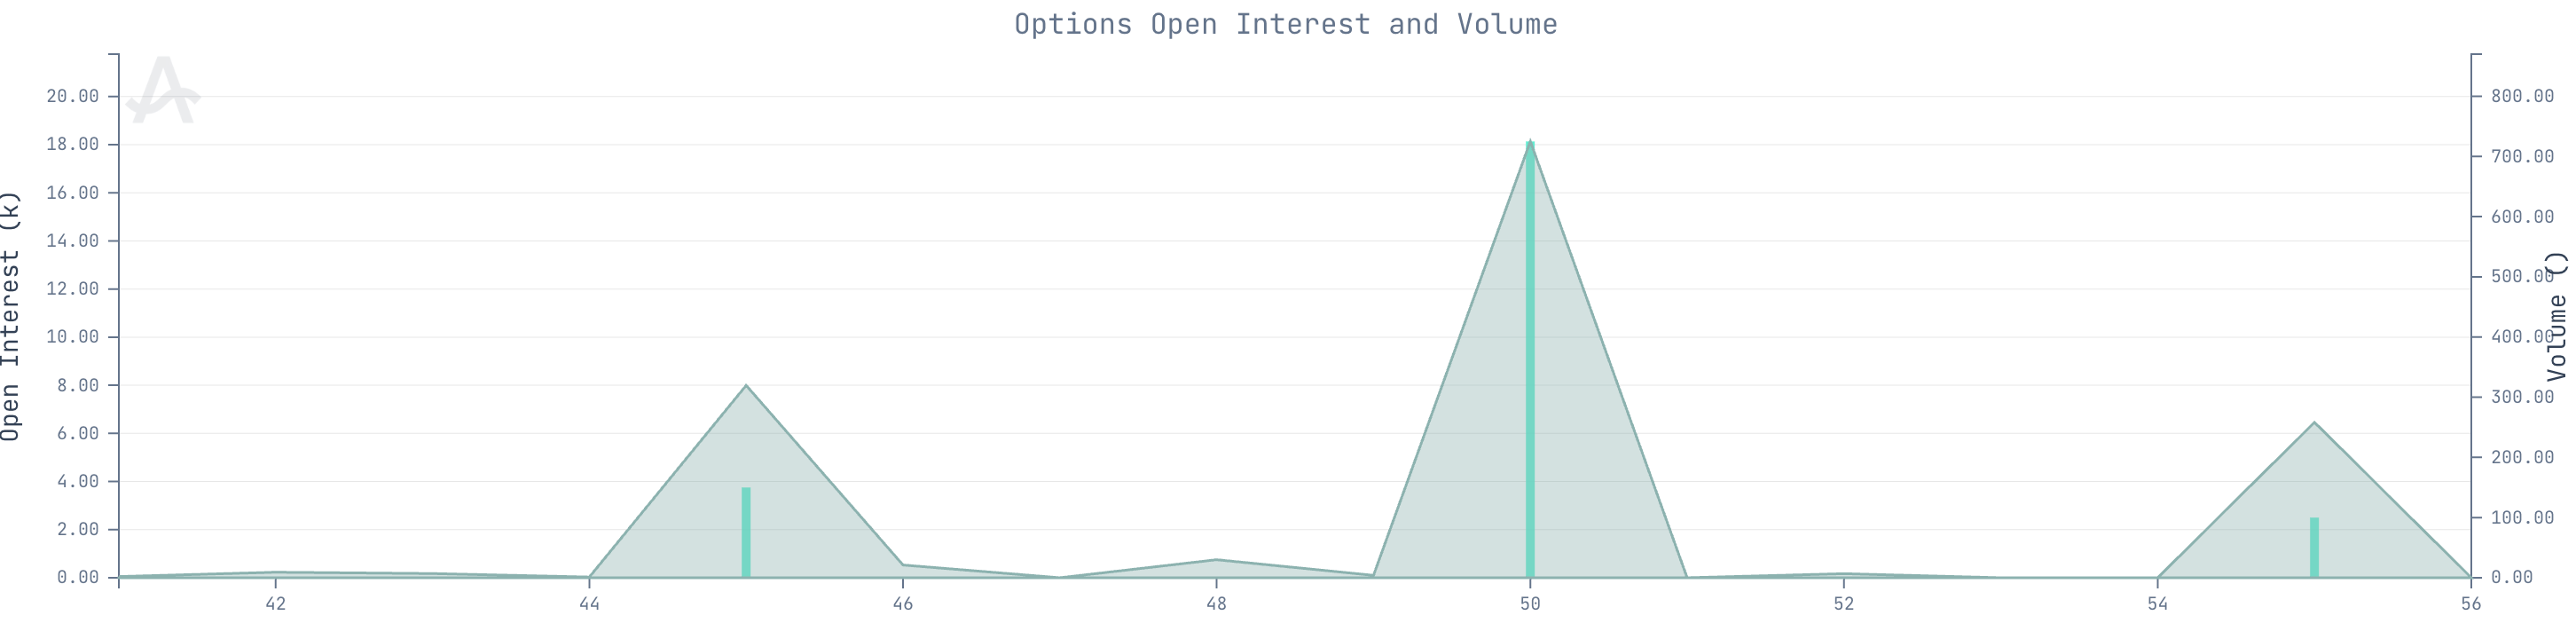
Timeline & Mini-map (Bottom)

- Zoom Control - Drag to isolate specific time windows
- Mini Map - Full range of OI and Volume for strikes
Data Sources
- Open Interest (OI) and Volume: Aggregated from end-of-day exchange reports.
- Strike Metadata: Pulled from listed option chains on the selected expiry date.
Interpretation Tips
- High OI + High Volume: Indicates deep institutional positioning — strikes with real capital behind them.
- High Volume, Low OI: Suggests short-term speculation, possibly intraday flow.
- Isolated OI Spikes: Could signal custom trades or legacy hedges.
- Volume Clusters Around Spot: Often indicative of active hedging zones or gamma activity.
- Peaks at Wings: May reveal tail-risk hedging or speculative bets on extreme moves.
Allasso Trade’s charts and interpretation tips describe market data and past behaviour. They are not a
forecast, and nothing in them is investment advice.