

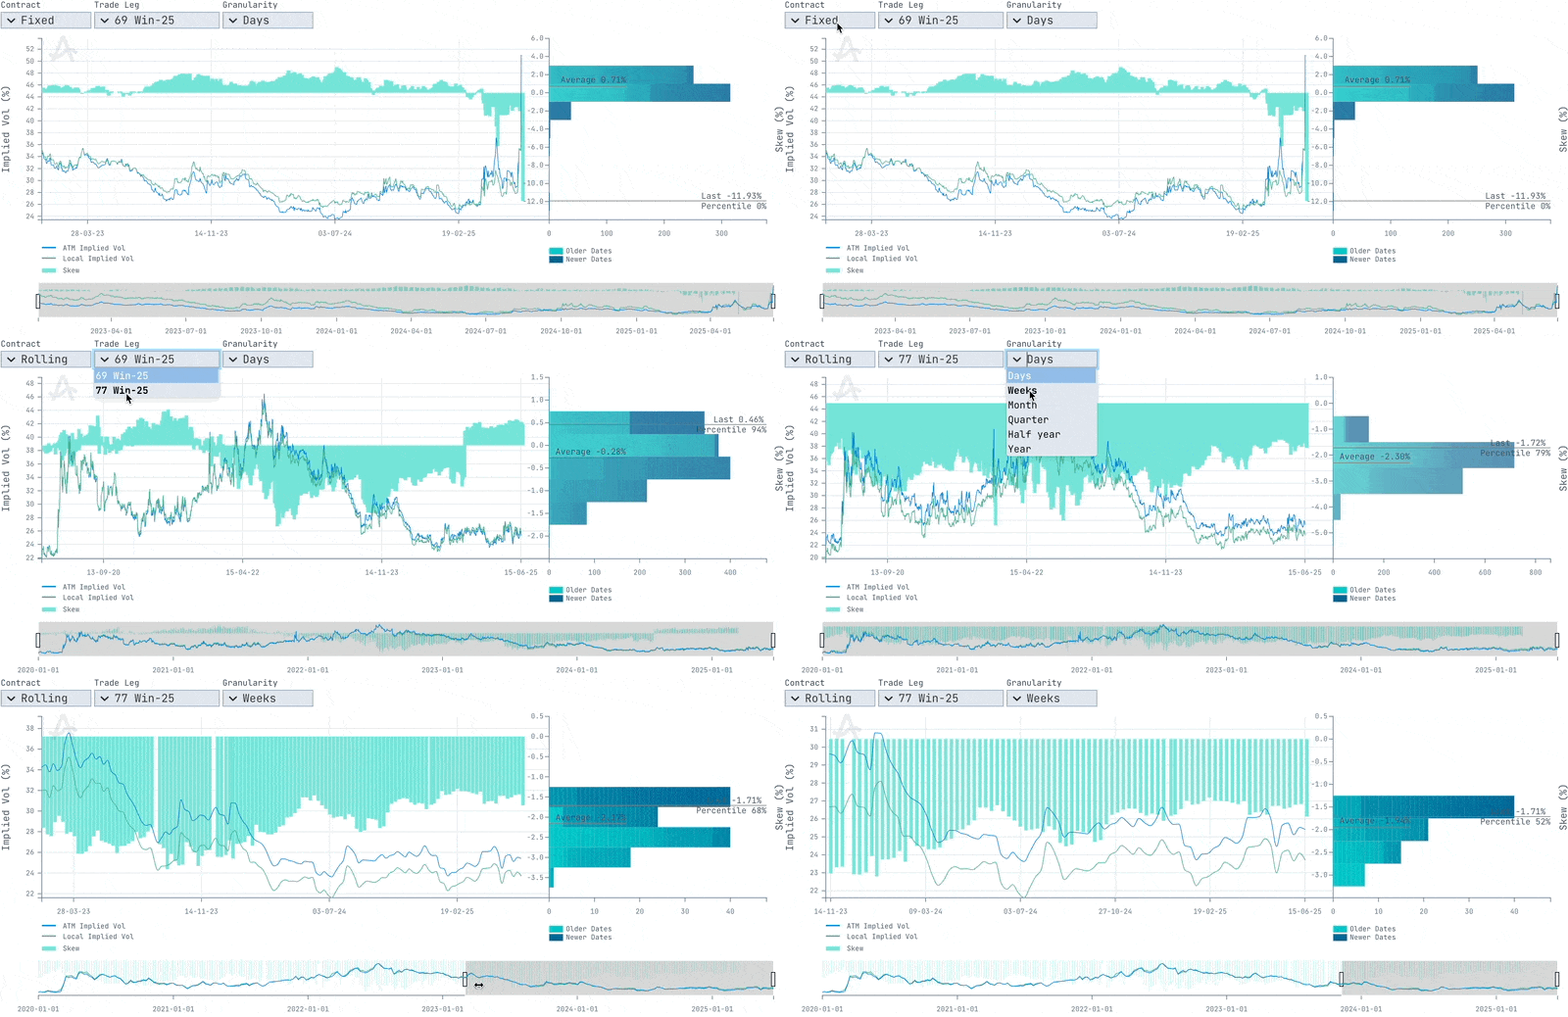
Description
This chart captures the volatility skew, showing the difference between the implied volatility of a selected leg and that of the at-the-money (ATM) strike over time. It is a critical tool for understanding directional sentiment, risk asymmetry, and pricing dynamics.Key Use Cases:
- Sentiment Gauge: Identify market preference for downside vs upside protection.
- Skew Trading: Support construction of trades targeting mispriced wings (e.g., risk reversals).
- Relative Value Monitoring: Detect changes in shape or slope of the skew over time.
- Risk Premia Analysis: Evaluate the premium embedded in OTM options relative to ATM.
Interactive Controls

- Contract - Defines rollover logic for maturities
- Rolling - Roll option to maintain similar contract for extended history.
- Fixed - Track full history of selected option.
- Trade Leg - Chooses the specific option series
- 77 Win-25 / 69 Win-25 - All single legs of selected structure.
- Granularity - Sets resolution for the summarisation. If > Days Granularity will be selected, data will be aggregated for this period.
- Days
- Weeks
- Months
- Quarter
- Half-Year
- Year
Chart Components
Time-Series Panel (Left)
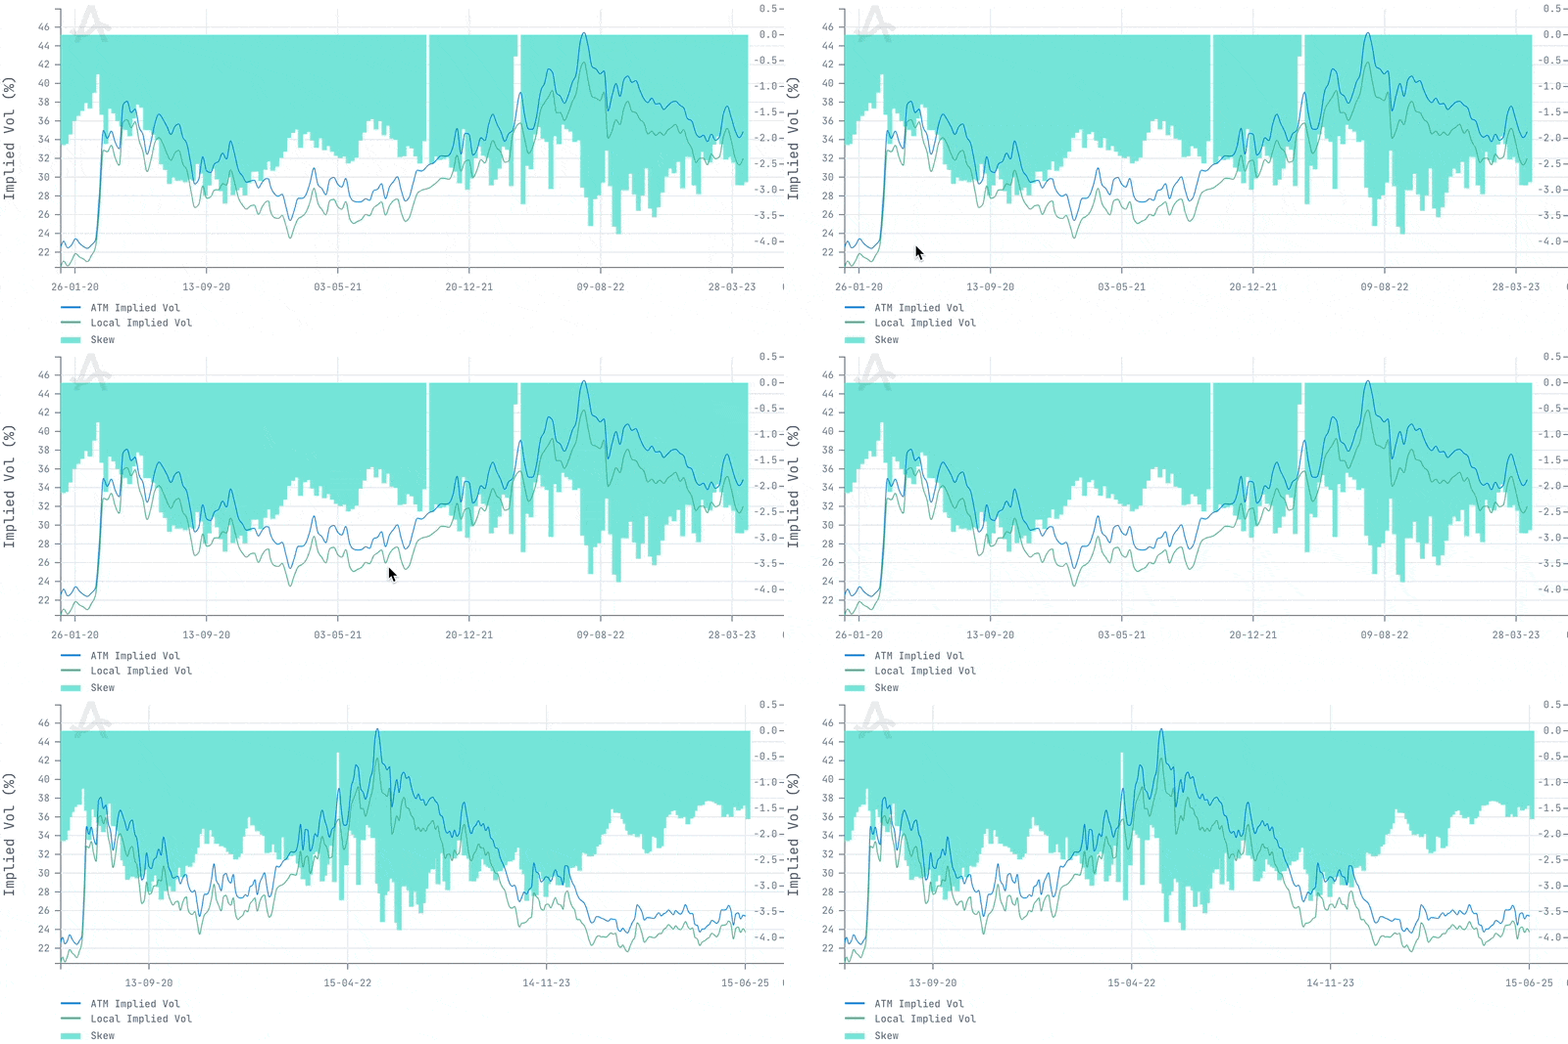
- 🔵 ATM Implied Vol – average volatility at the at-the-money strike.
- 🟢 Local Implied Vol – implied volatility at the selected trade leg’s strike.
- Histogram - Visualises the difference between local and ATM IV
- Skew = ATM IV - Local IV
Distribution Histogram (Right)
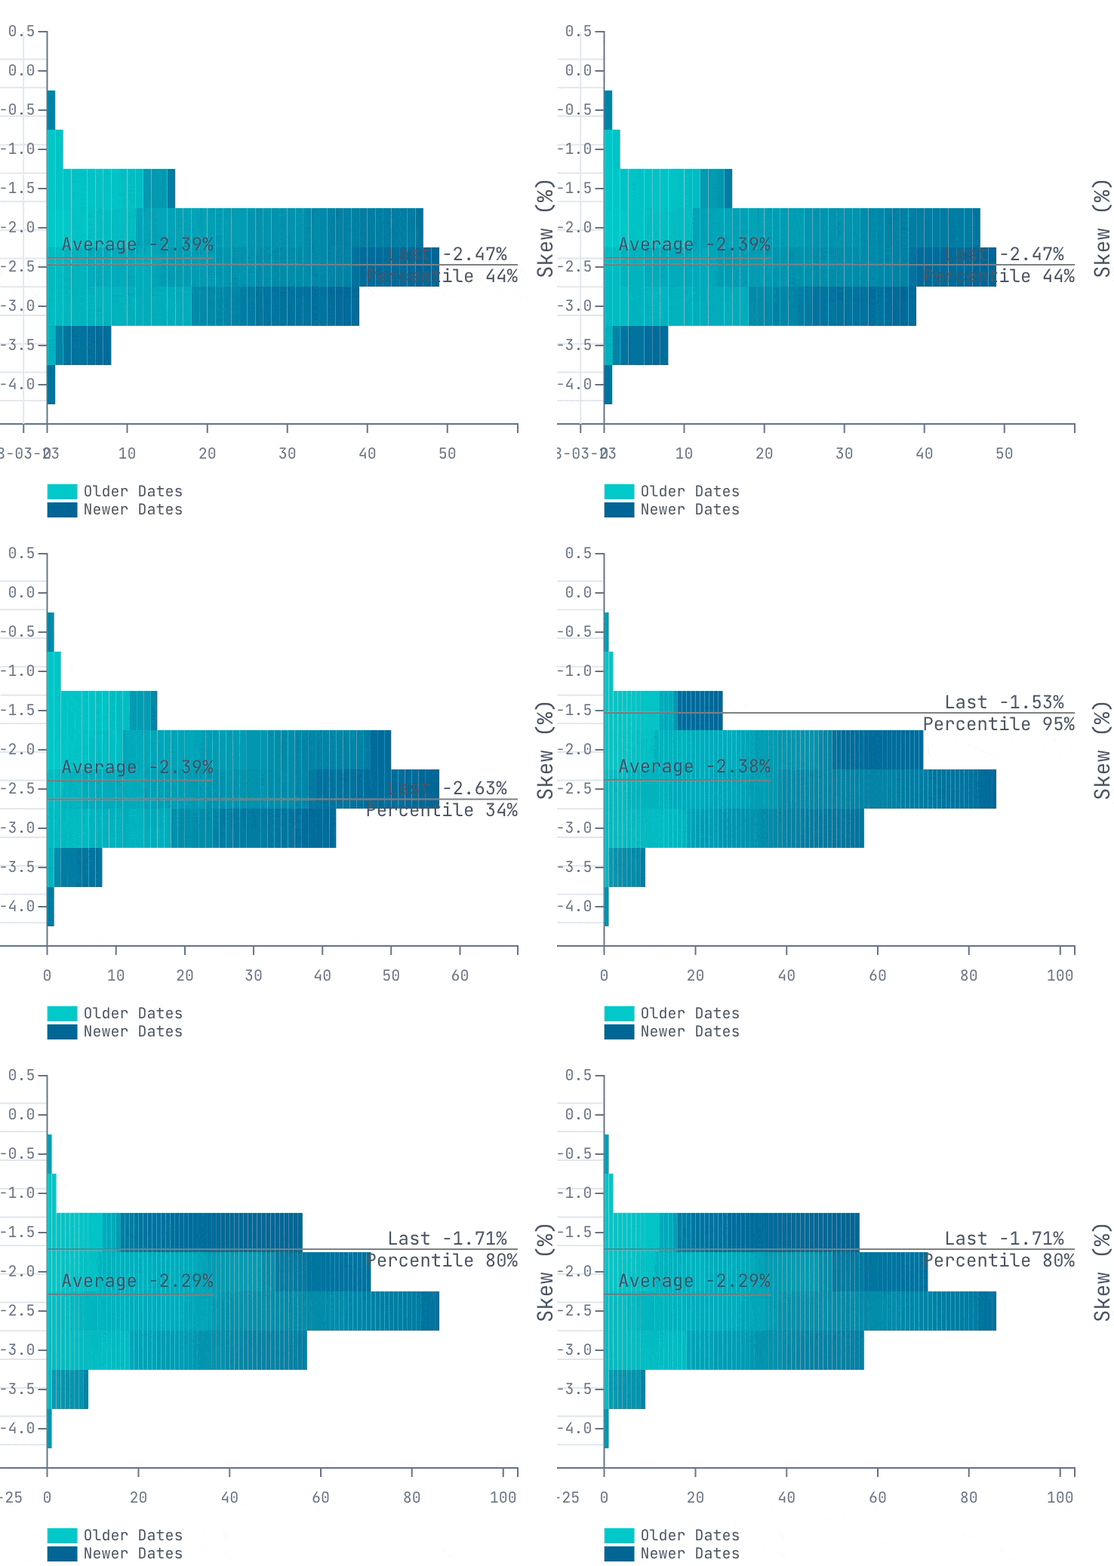
- Histogram - Histogram of Skew for the selected time range
- Bar Colors - Light teal = Older data, Dark blue = Recent data
- Average Line - Dashed horizontal line shows historical average
- Last Line - Most recent Skew.
- Percentile Marker - Current Skew is in the X% percentile

- Zoom Control - Drag to isolate specific time windows
- Mini Map - Full range of Underlying and IV / Price history
Data Sources
- ATM Implied Volatility: Derived from interpolated implied vol for the strike closest to current underlying price.
- Local Implied Volatility: Corresponds to the selected leg’s strike IV.
- Skew Calculation: Simple difference between Local IV and ATM IV.
- Distribution Data: Full time series used to compute percentiles and histogram.
Interpretation Tips
- Positive Skew: Local strike has higher IV than ATM → indicates higher pricing for tail events (e.g., demand for OTM puts).
- Negative Skew: Local strike has lower IV than ATM → suggests lower perceived risk or lack of demand for tail protection.
- Low Percentile (e.g., 0%): Current skew is historically extreme.
- Sudden Spikes/Drops: Could signal structural shifts, such as upcoming macro events or stress.
Allasso Trade’s charts and interpretation tips describe market data and past behaviour. They are not a
forecast, and nothing in them is investment advice.