

Description
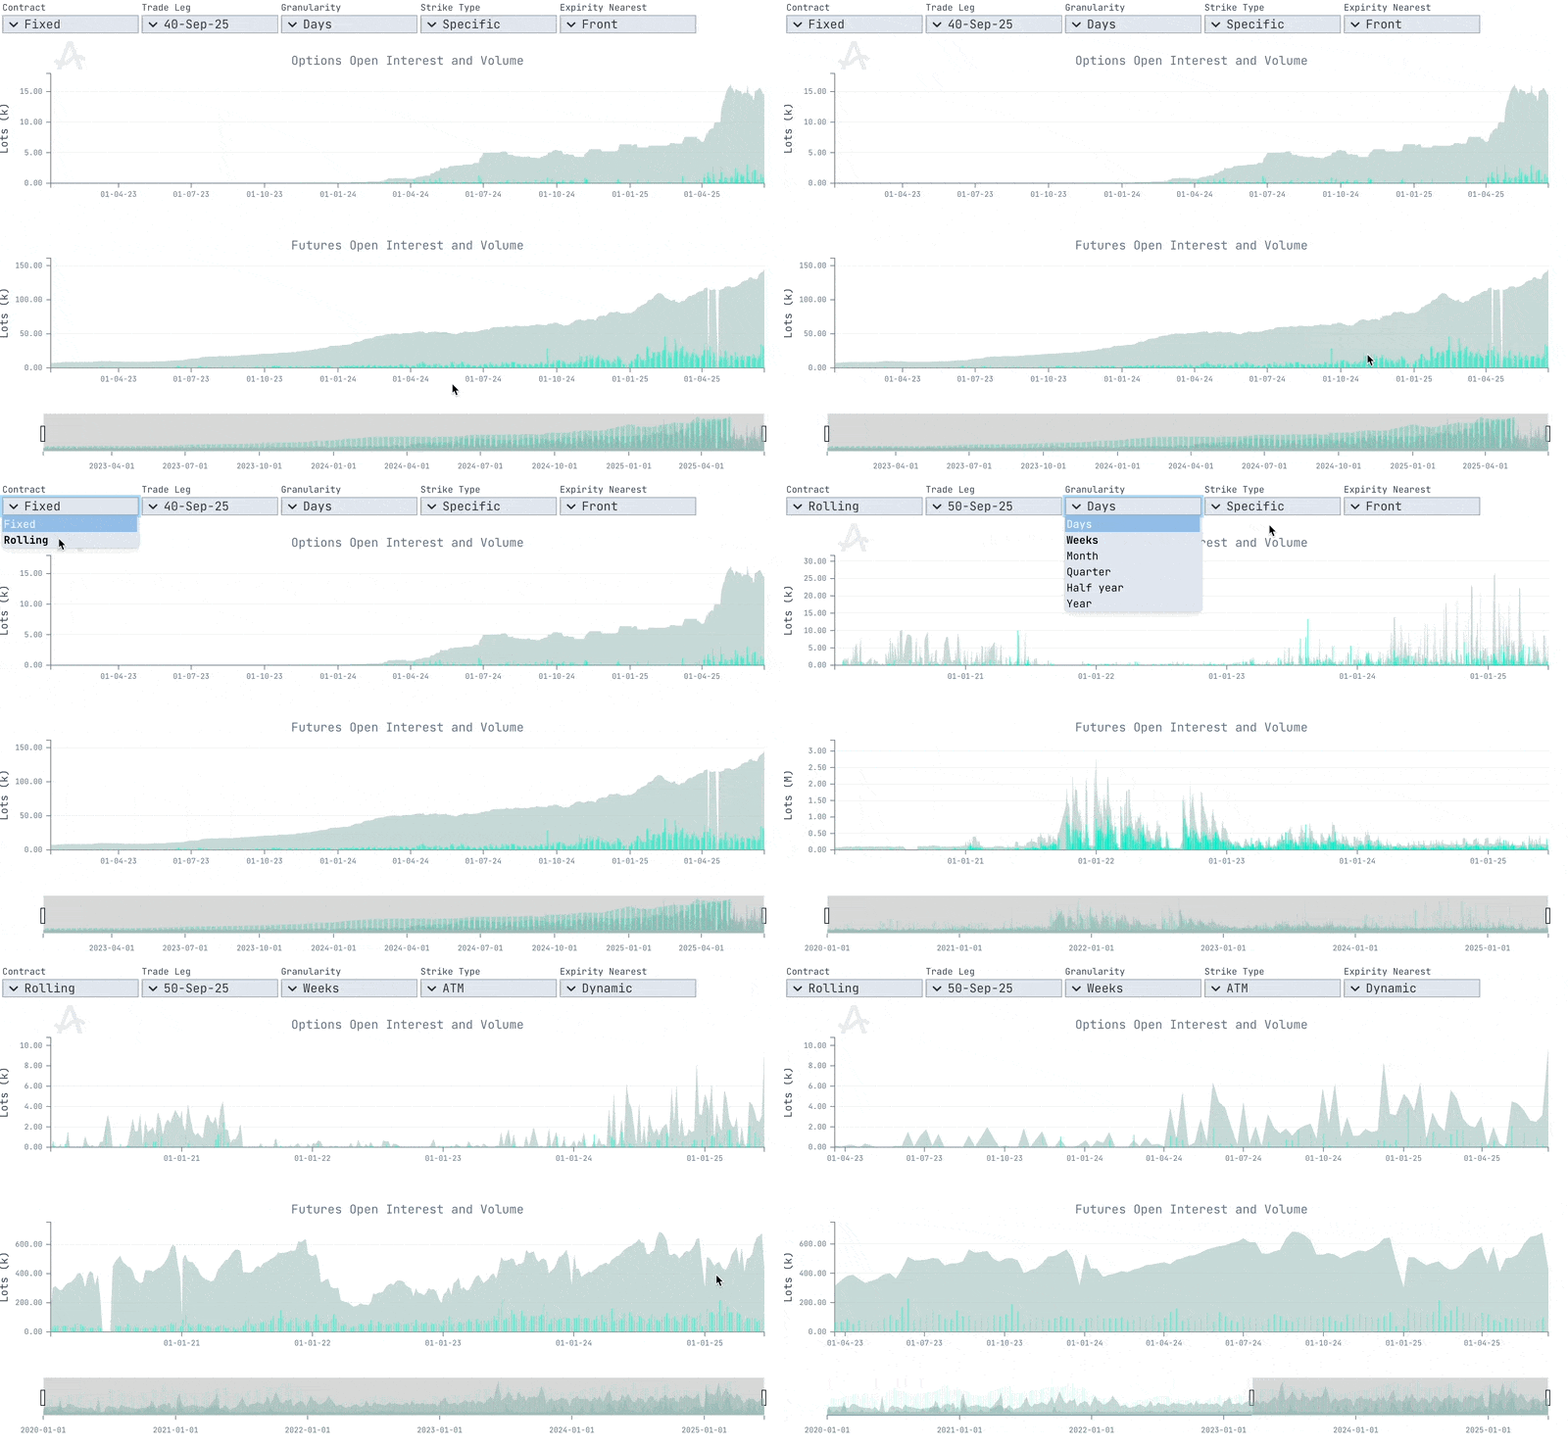
This dual-panel chart visualises the historical evolution of open interest (OI) and trading volume for both options and futures tied to a selected structure. It offers a clear lens into market activity, participant commitment, and liquidity growth over time. The Open Interest & Volume History tab is designed to track how institutional activity, speculative positioning, and hedging demand evolve for a specific option strike and its related futures. It helps assess market maturity and the timing of interest inflows.Key Use Cases:
- Evaluate liquidity trends before entering or exiting trades.
- Detect supply-demand imbalances through sudden OI shifts.
- Monitor how trader engagement builds around specific expiries or strikes.
- Correlate historical spikes in volume/OI with price action or events.
Interactive Controls

- Contract - Defines rollover logic for maturities
- Rolling - Roll option to maintain similar contract for extended history.
- Fixed - Track full history of selected option.
- Trade Leg - Chooses the specific option series
- 50 Sep-25 / 40 Sep-25 - All single legs of selected structure.
- Granularity - Sets resolution for the analysis. If > Days Granularity will be selected, data will be aggregated for this period.
- Days
- Weeks
- Months
- Quarter
- Half-Year
- Year
- Strike Type - strike to use for analysis of options leg
- Specific - Use actual strike of the selected leg
- ATM - Use ATM strike fro the selected maturity
- Expiry - select the maturity to be used
- Dynamic - actual maturity for the selected leg
- Front - always using the front month
Chart Components
Options Open Interest and Volume (Top)
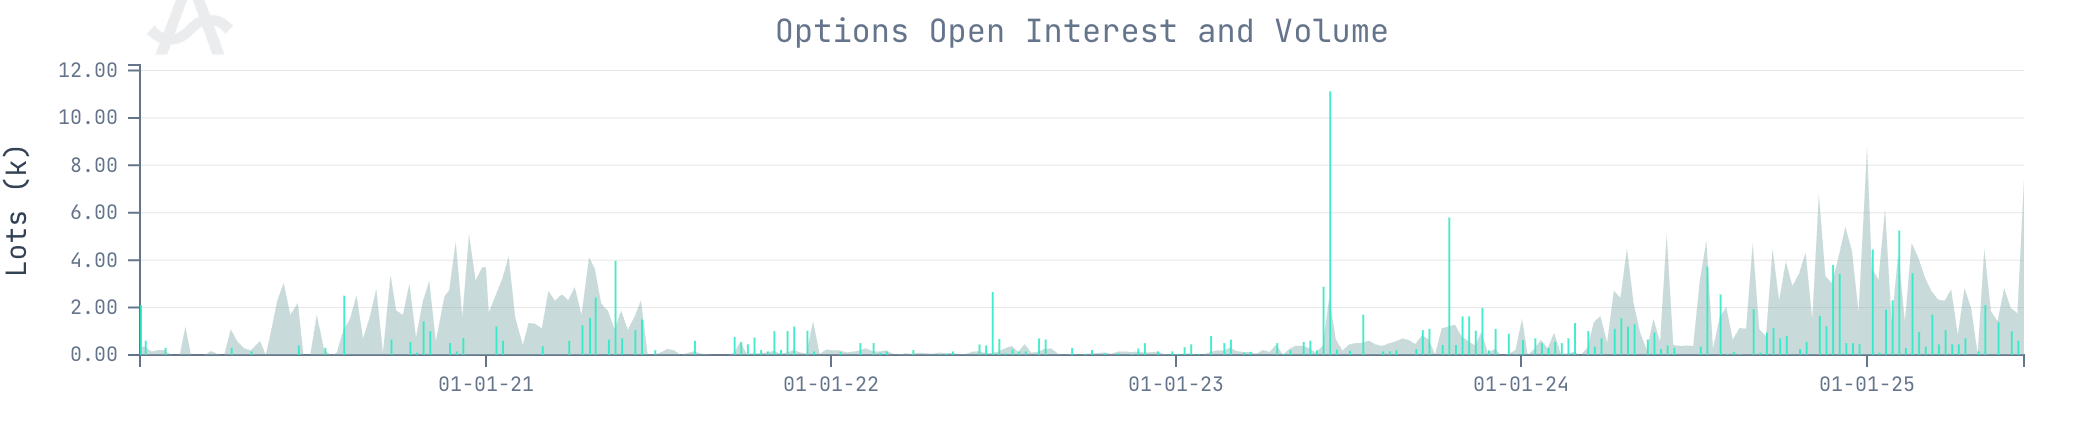
- Shaded Area (Background): Open Interest for the selected option strike.
- Vertical Bars: Trading volume for the selected option strike.
- Scale: Y-axis on left (in thousands of lots), X-axis is time.
Futures Open Interest and Volume (Bottom)
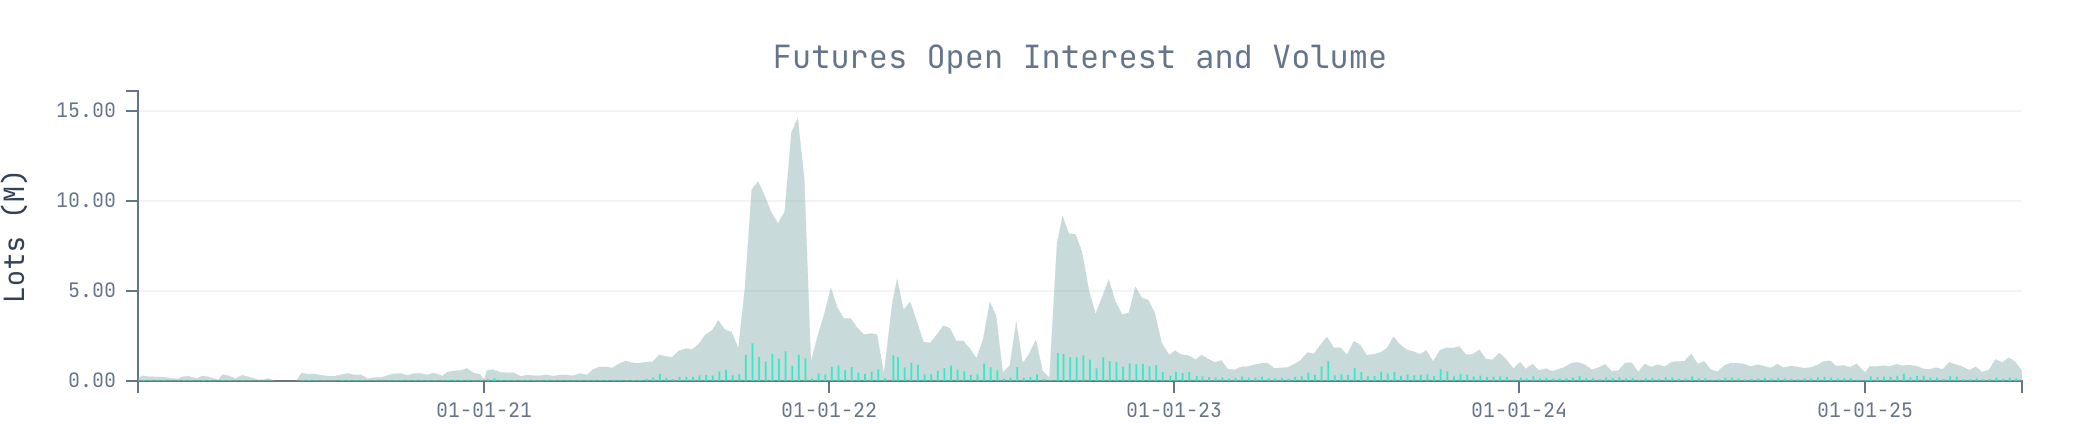
- Same structure and visuals as the options panel, but for the underlying futures contract.
Timeline & Mini-map (Bottom)

- Zoom Control - Drag to isolate specific time windows
- Mini Map - Full range of OI and Volume history
Data Sources
- Open Interest and Volume: Aggregated from exchange-reported end-of-day positions.
- Strike-level Filtering: Derived from options chain data specific to the selected trade leg.
Interpretation Tips
- Rising OI + Volume: Indicates fresh positioning — new risk being added to the market.
- Flat OI + High Volume: Suggests short-term trading or hedging with frequent open/close activity.
- OI Surges Before Expiry: Can signal active rolling or speculative bursts.
- Compare Options vs Futures:
- Strong options activity with lagging futures = speculative behavior.
- Futures-led action = likely hedging or directional macro flows.
Allasso Trade’s charts and interpretation tips describe market data and past behaviour. They are not a
forecast, and nothing in them is investment advice.