

Description
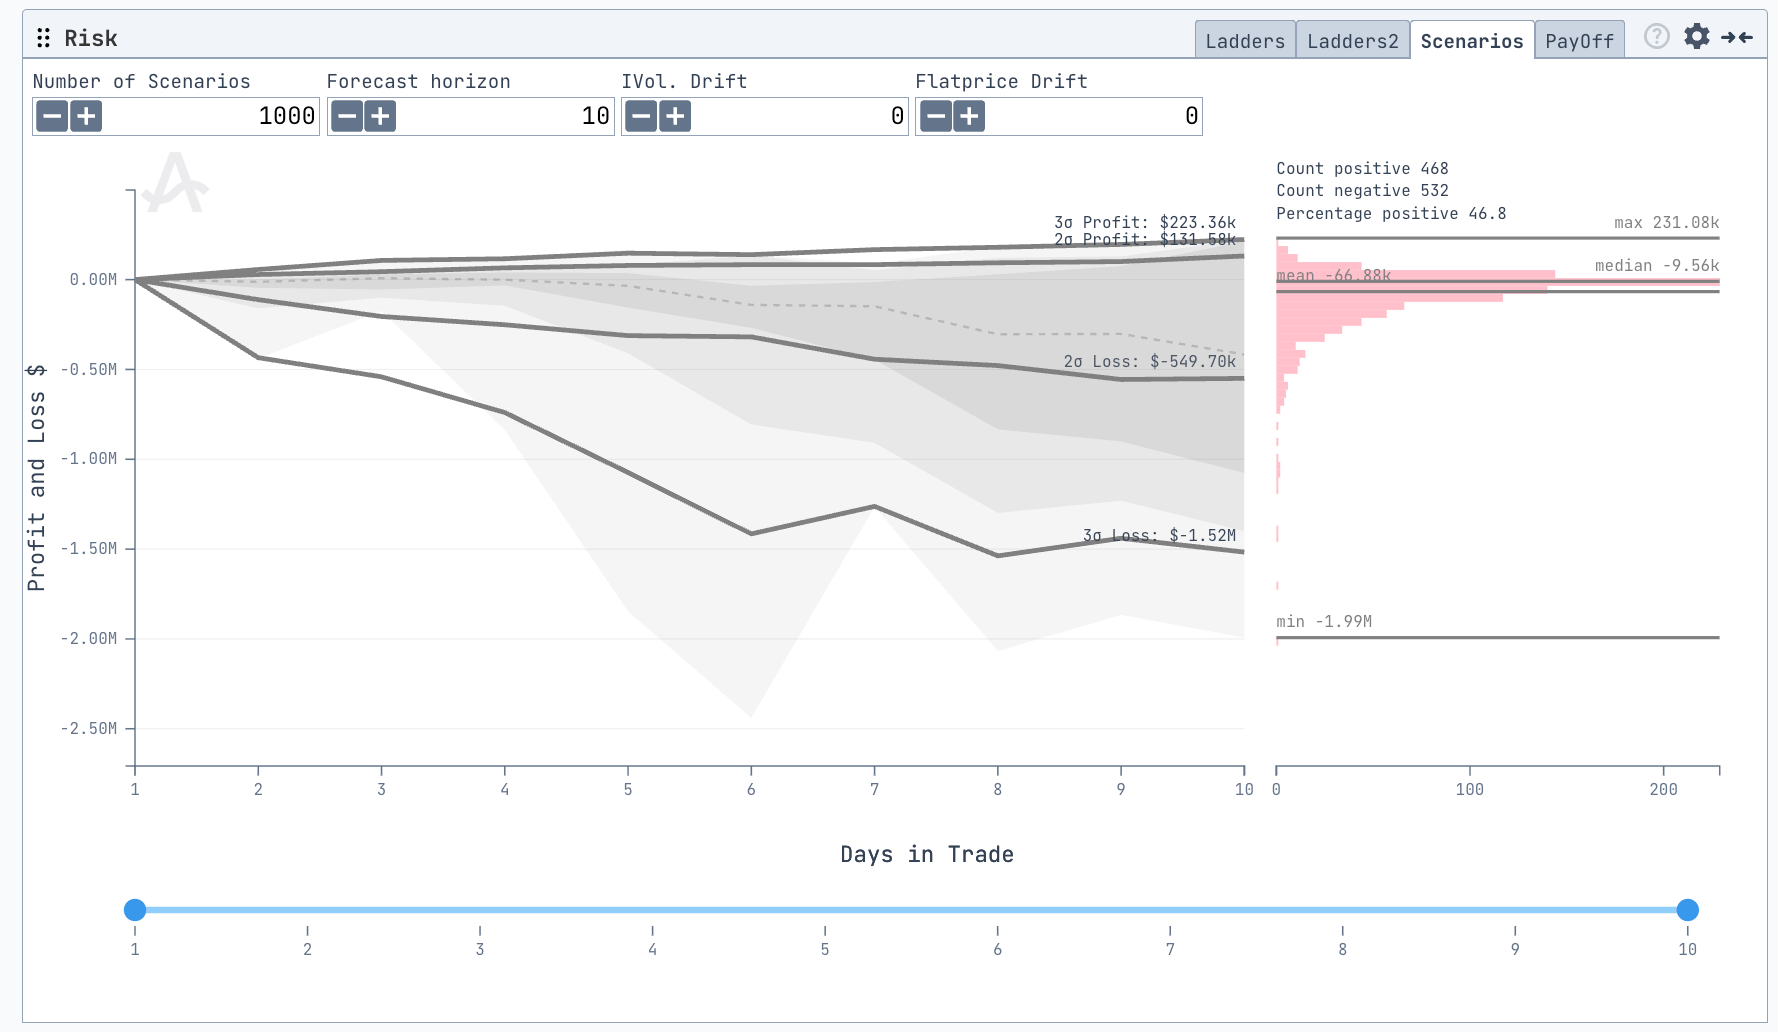
Interactive Controls


Chart Components
P&L Fan Chart (Left Panel)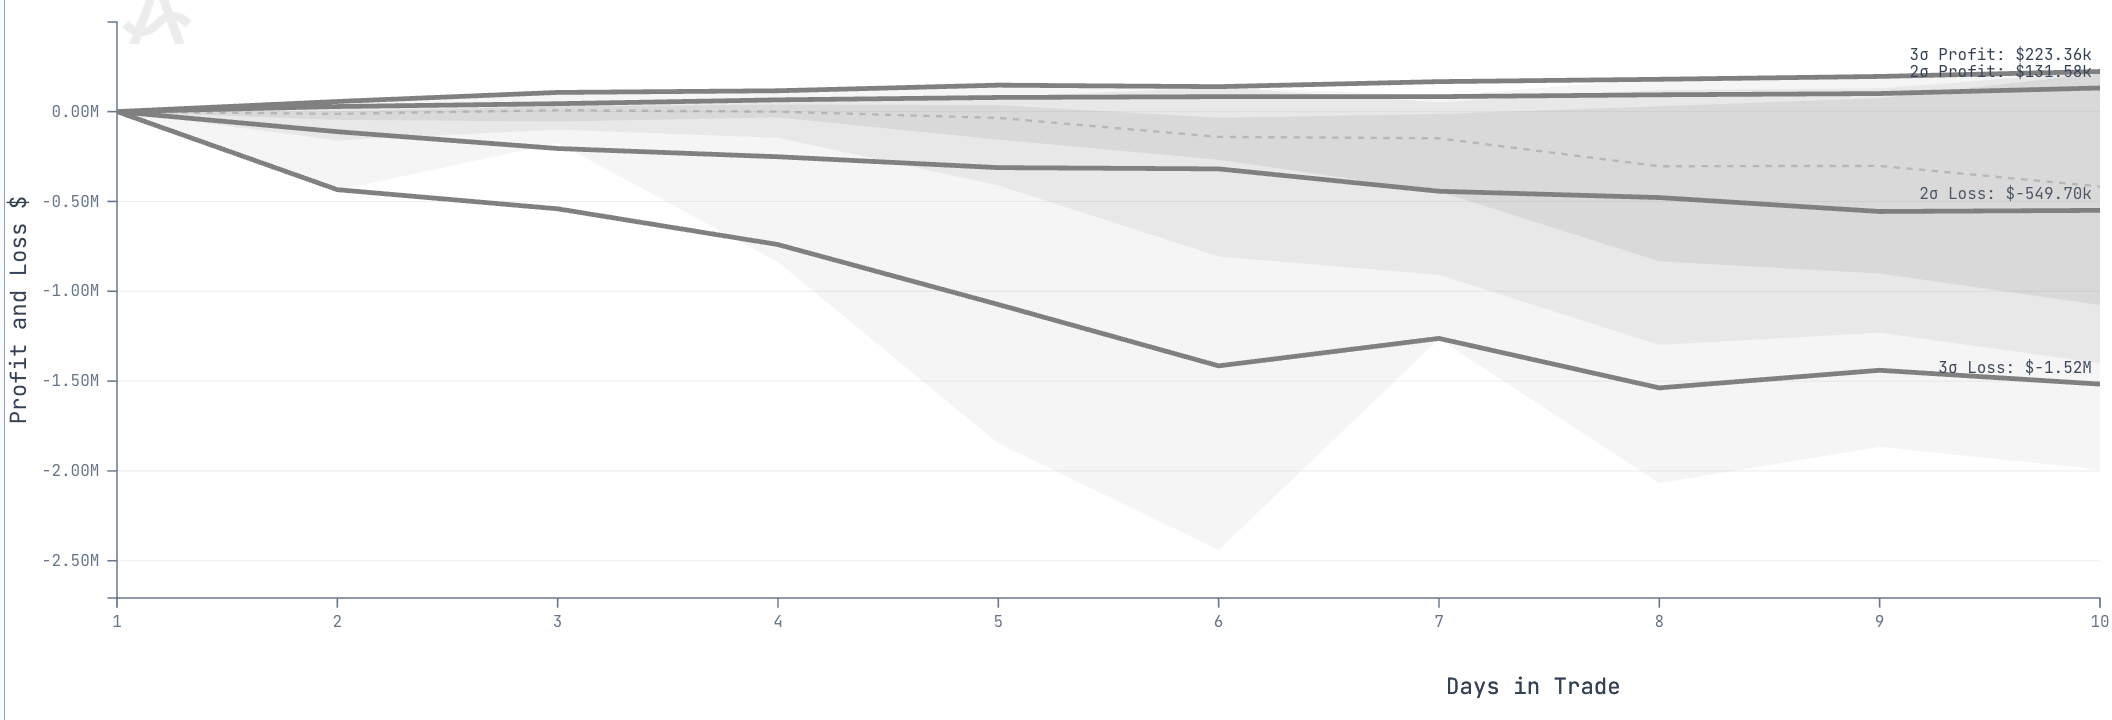
- Solid Lines: Median and ±2σ, ±3σ envelopes of P&L across all simulated paths.
- Vertical Axis: Profit & Loss ($).
- Horizontal Axis: Days in Trade.
- Interactive Cursor: Hover or slide to reveal per-day summary statistics.
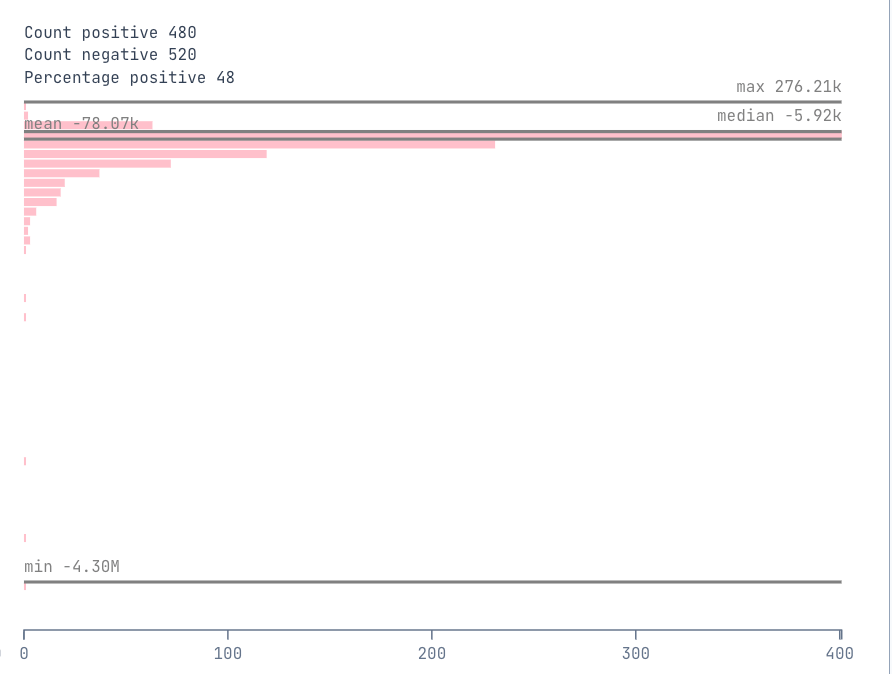
- Displays the P&L distribution on the selected day from all simulated paths.
- Stats Panel:
- Count Positive / Count Negative
- % Positive (win-rate)
- Min / Median / Mean / Max P&L
Data & Methodology
- Historical Sampling: Random contiguous blocks of Y days are drawn from historical daily moves (returns and iv moves).
- Path Construction: Each block is compounded from the current underlying or flat price, with optional drift adjustments.
- Re-valuation: The selected trade or strategy is repriced along each simulated path using the current volatility surface adjusted by drift parameters.
- Aggregation: P&L results across all paths are summarized into mean, variance bands, and distribution statistics.
Sampling contiguous windows preserves short-term correlation and volatility clustering that pure random shuffles would lose — producing more realistic outcomes.
Allasso Trade’s charts and interpretation tips describe market data and past behaviour. They are not a
forecast, and nothing in them is investment advice.