

Description
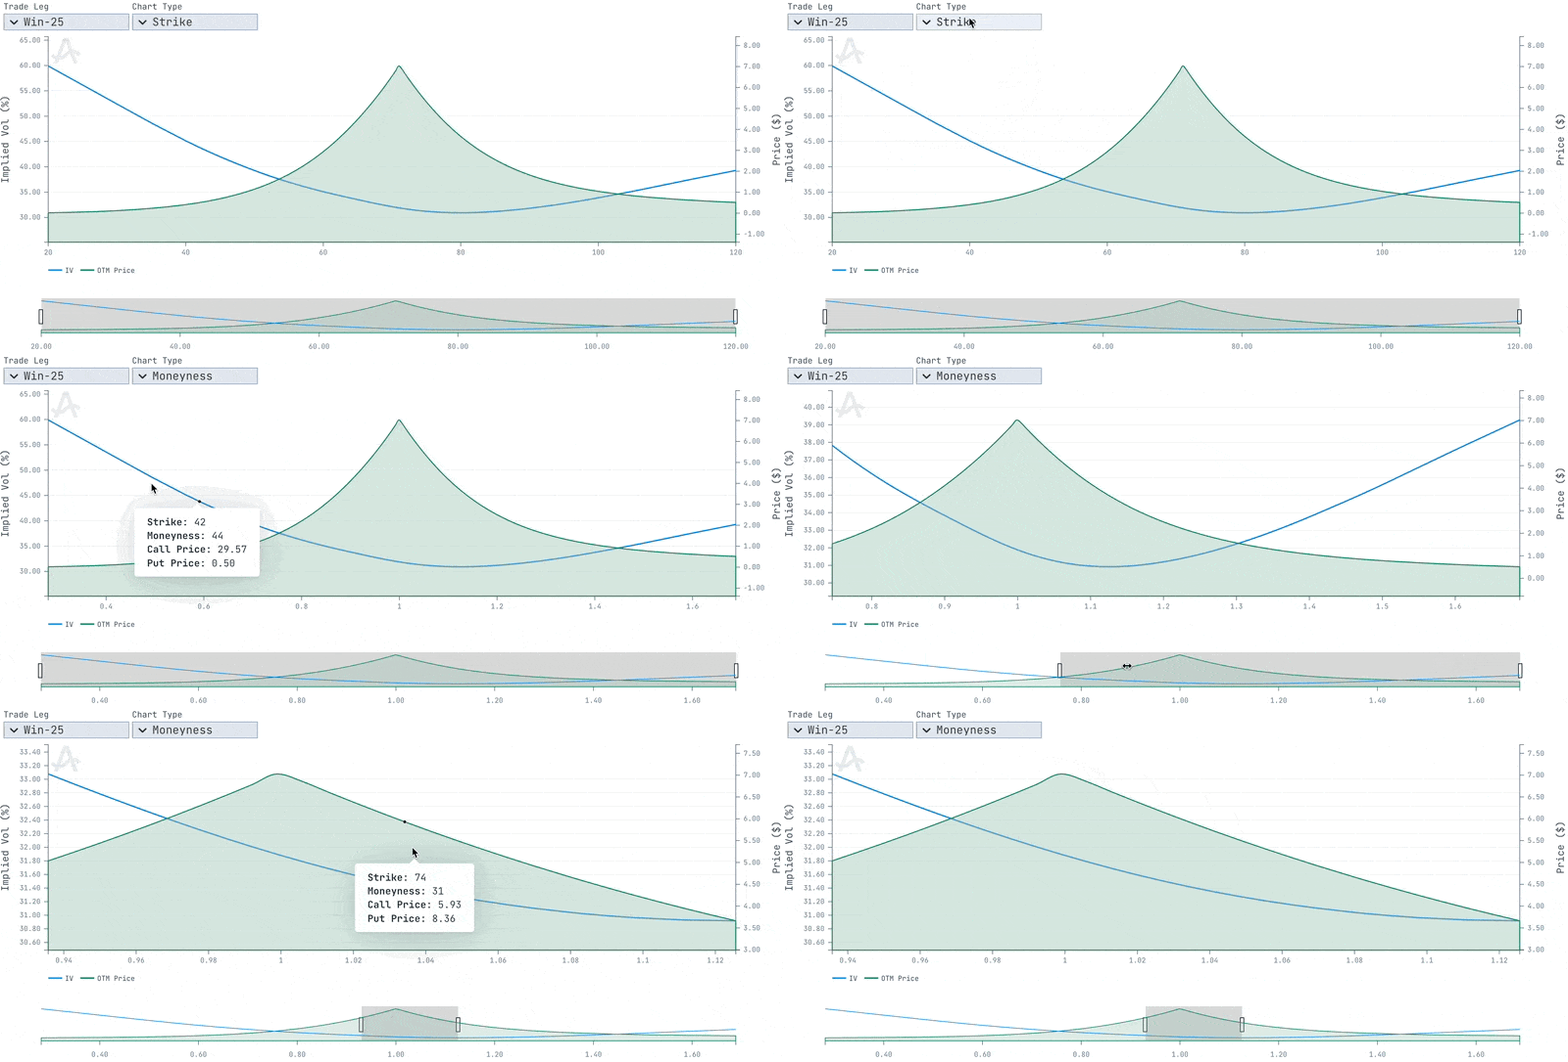
This chart visualises the volatility “smile” — the relationship between implied volatility (IV) and the strike prices for a selected option period. It helps traders assess market expectations for extreme moves and compare relative richness across strikes.Key Use Cases:
- Skew Detection: Understand whether downside or upside strikes carry higher IVs (risk premia).
- Relative Pricing: Compare IV vs price to find mispriced options across strikes.
- Volatility Surface Analysis: Assess curvature or asymmetry in the IV curve for model calibration or trade design.
Interactive Controls

- Trade Leg Selector (e.g., Win-25): Choose the specific leg or strategy component to analyse.
- Chart Type: Configures the X-axis variable
- Strike
- Moneyness
- Delta
- Quickdelta
Chart Components
Smile Panel (Top)
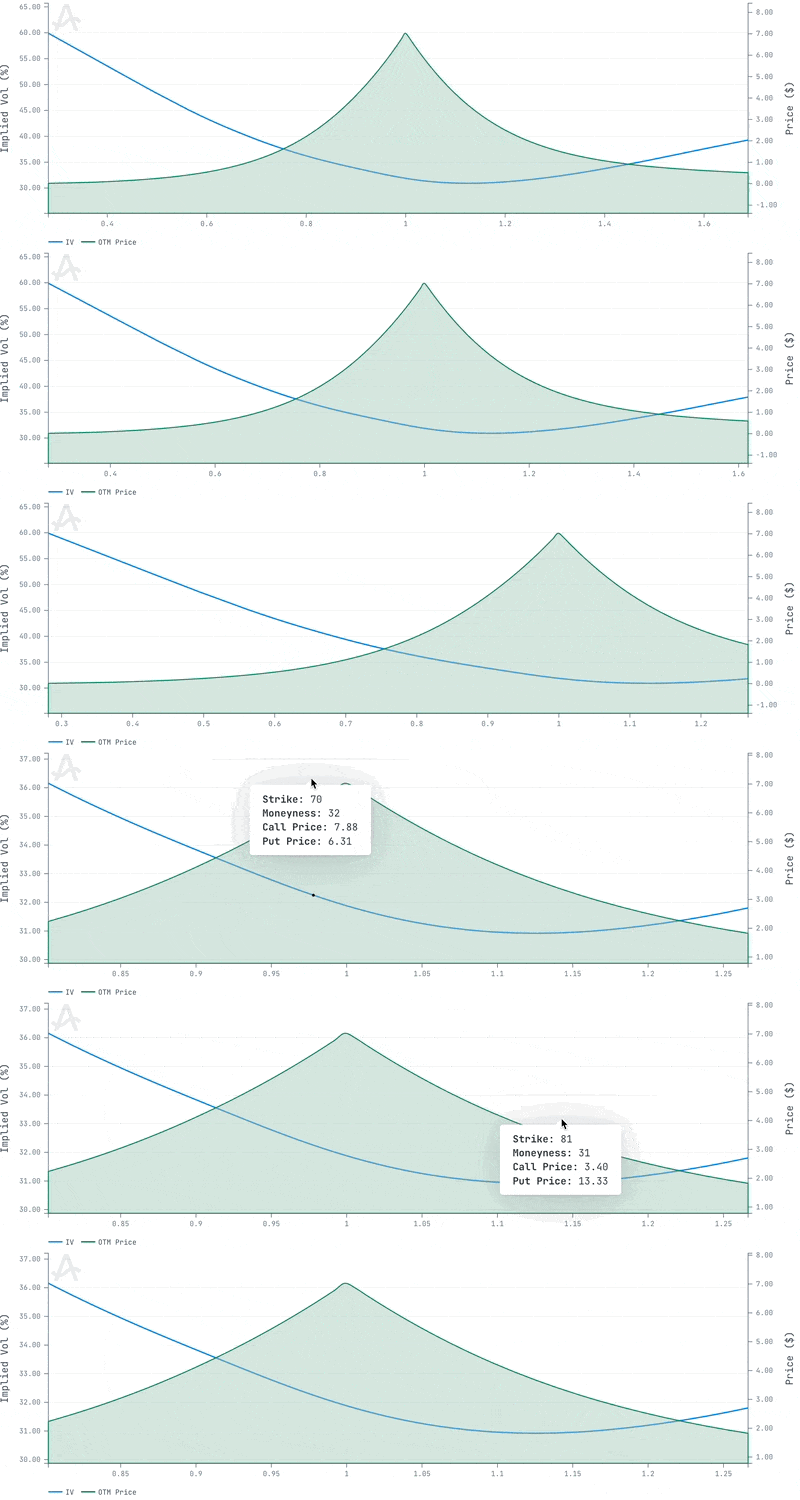
- Blue Line – IV Smile (Left Y-axis)
- Plots Implied Volatility across different strike prices (mny / delta / quickdelta)
- Green Line & Area – OTM Option Price (Right Y-axis)
- Represents the price of out-of-the-money options at each strike.
Timeline & Mini-map (Bottom):

- Zoom Control - Drag to isolate specific time windows
- Mini Map - Shows a a full range of IV Smile and Spread history
Data Sources
- Implied Volatility Data: Derived from market option prices, fitted or interpolated per strike.
- OTM Prices: Extracted from latest settlement (close) price levels for selected period options.
- Strike Range: Includes all relevant strikes across the selected expiry and trade leg.
Interpretation Tips
- Classic Smile Shape: Both wings (low/high strikes) have higher IV than ATM — common in majority of the markets
- Downward Skew: Right (calls) has lower IV than left (puts) — indicates crash risk premium.
- Inverted Skew: Right side richer — possible in bullish or commodity contexts.
- Divergence between IV and Price: Useful for spotting rich/cheap trades not obvious from price alone.
- Use in Structure Design: Shows which strikes carry high or low IV when you place the legs of a structure.
Allasso Trade’s charts and interpretation tips describe market data and past behaviour. They are not a
forecast, and nothing in them is investment advice.